 The last three months since Wiley published our book, Tensile Trading, has given us a unique opportunity to talk with many investors. In doing so, we’ve been able to discuss with them the big picture challenges of managing one’s assets, as well as hear unique testimonials extolling the organizational value of the ChartPack.
The most common refrains we hear from investors is that until now they had struggled without a clear and simple process. As they’ve explained, our book has not just given them an organizational structure but it has allowed them to incorporate their own investment needs and inclinations into a personalized methodology. One investor told us that the book really “plugged the holes in my money management ship.”
In the book we don’t specifically talk about the ChartPack, but we do describe the systemization and unity of elements and how best to group lists to monitor the markets and track your positions. Remember that the stock market operates on the ‘law of groupings’, and it is crucial that individual investors embrace and organize themselves to reflect this reality.
We know of no other tool available out there which provides investors with instant structure in the manner achieved by the Tensile Trading ChartPack. There are reasons for this. I’ve spent 16 years building these charts and using them profitably to trade my own personal assets. In the three years since I made it available to money managers and investors, we’ve had thousands of users provide helpful insights, updates and improvements.
This quarter once again carries on that tradition. There are over 200 new enhancements in version 8.25 that will absolutely help you improve your investment skills. Not all are described below, but this blog provides an overview of the key improvements in this current update. We always welcome new Chartpackers, and we’re grateful to those existing ChartPack users who’ve given us so many powerful and valuable suggestions. As one of the users recently wrote me, “I wish I had this 10 years ago.”
ChartList 10.2: Large Caps, Mid Caps and Small Caps
I would encourage all chartists to make regular use of the Verbose feature. Think of it as your talkative friend who explains all the ticker symbol labels. When you pull down the “Charts Attributes/Legends” menu, you’ll find the Verbose feature.
This ChartList has been updated with all Verbose labels so you no longer have to remember that IJH is mid-caps and IJR is small-caps. It’s all labeled in long form so you can quickly understand what you are looking at.
 ChartList 10.4: Permission to Sell Dashboard
I would encourage all investors to review these 13 charts and ask how you might improve your own graphs using these charting tools. Here we focused on four elements that truly punch up how insights literally leap off the screen.
- Play with custom chart sizes. Note that increasing the height of some charts will increase the visual separation of the various equities being plotted.
- With the Legends pull-down menu, using the Verbose function listed under Chart Attributes will add clarity as ticker symbols are explicitly described in long form.
- Use colors to highlight differences more vividly. Using black lines over gray or brown lines simply doesn’t cut it. Be bold and experiment!
- In Charts 4.25 and 4.8, note how the relationships become more obvious by plotting a separate Price Relative pane above or below the main chart.
Suggestion: Use the ChartPack for ideas to enhance your own charts. This will help you better enjoy the time you spend reviewing your visual routines.
 ChartList 10.5: Super List
This is a consummate example of how the ChartPack continues to evolve and improve. Notice how we use separate panes (as opposed to overlays) on charts such as:
a) Defensive or Cyclical
b) US$ versus Commodities
c) USA versus International
By doing so, the relationships literally bound off the screen.
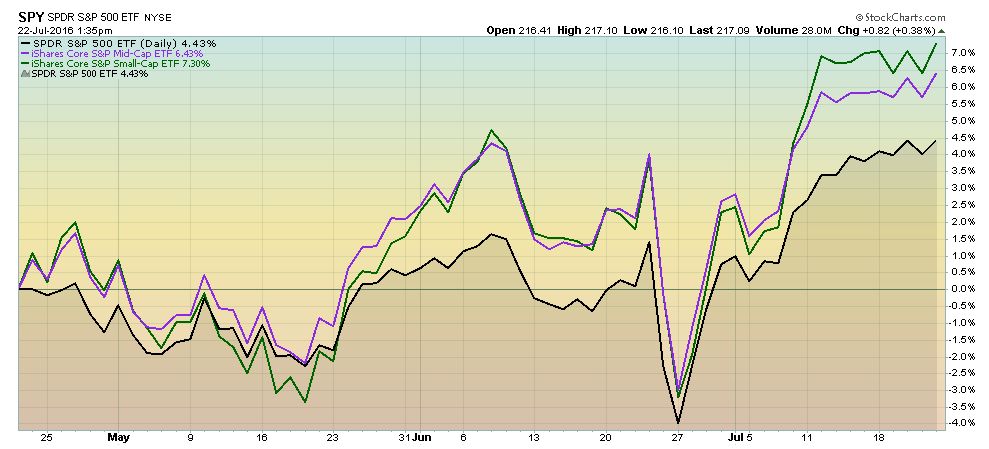
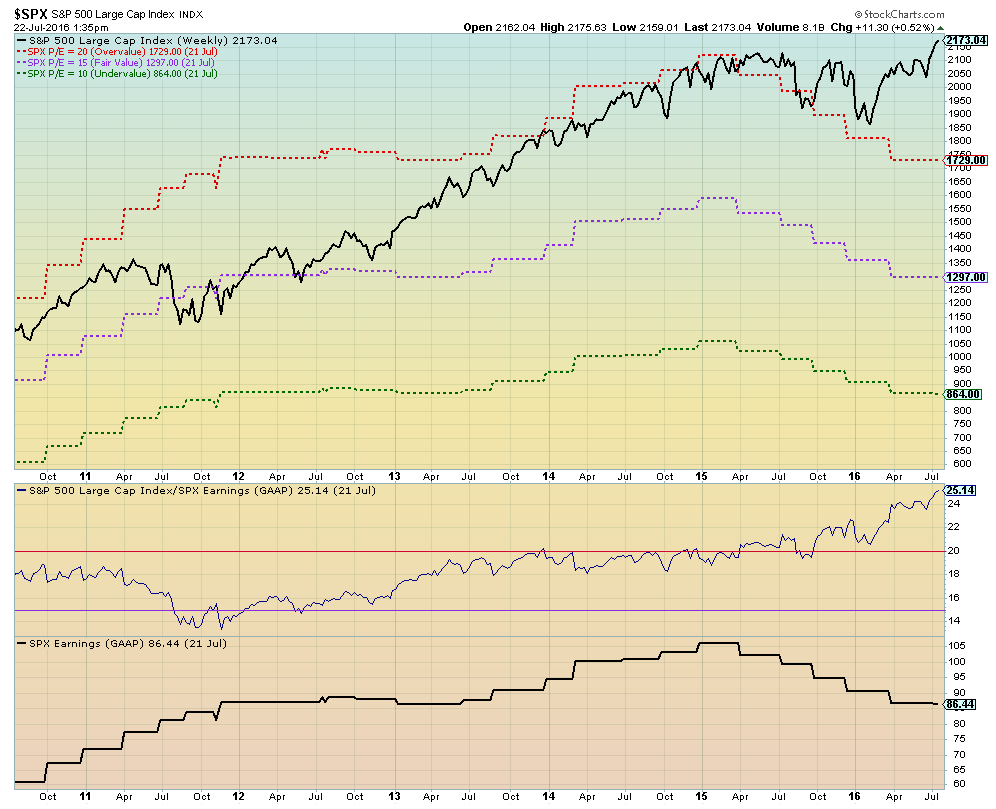
We added area plots to charts such as Large Cap versus Mid Cap versus Small Cap which likewise will improve your analysis. We have also added and updated the very popular S&P 500 Earnings and P/Es chart to this ChartList.
 ChartList 105: Top 100 ETFs
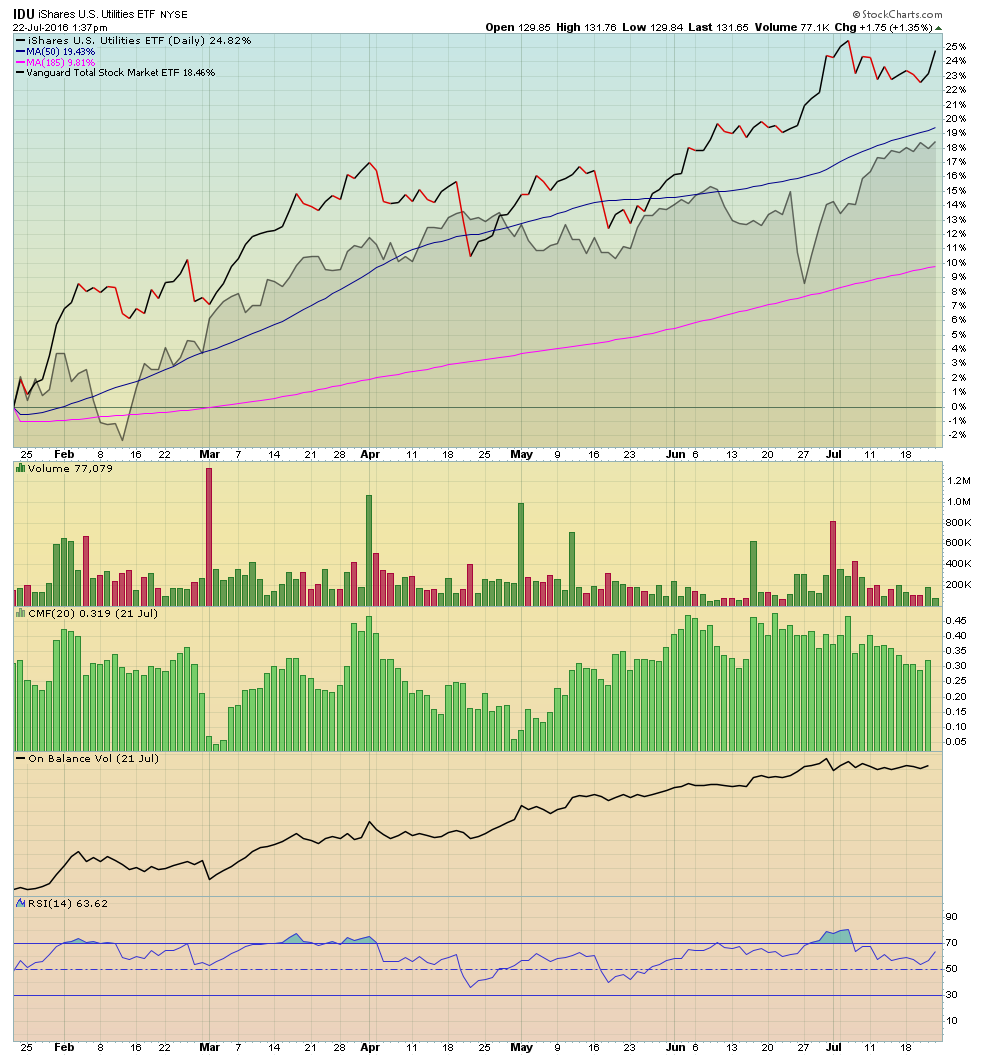
When we review the top 100 trading ETFs (based on volume), we want to quickly answer these key questions:
- Is the ETF outperforming the market (VTI) and by roughly how much in percentage terms.
- What’s the directional tide of money flow (in or out) and how sizeable is that flow?
All 100 charts have been reformatted to allow you to quickly and precisely answer those questions. You can see from the same Utilities chart that (1) utilities are outperforming the market (VTI) by over 4%; (2) the tide of money flow is positive; and (3) it is sizeable in positive volume. By scanning all top 100 ETFs, your finger will be on the trigger exactly where the action is happening.
 ChartList 108: U.S. Russell Indexes
This has always been a favorite ChartList of mine since all 16 Russell indexes are in one place for quick review. You appreciate specifically what is going on in US markets after a quick review of this list.
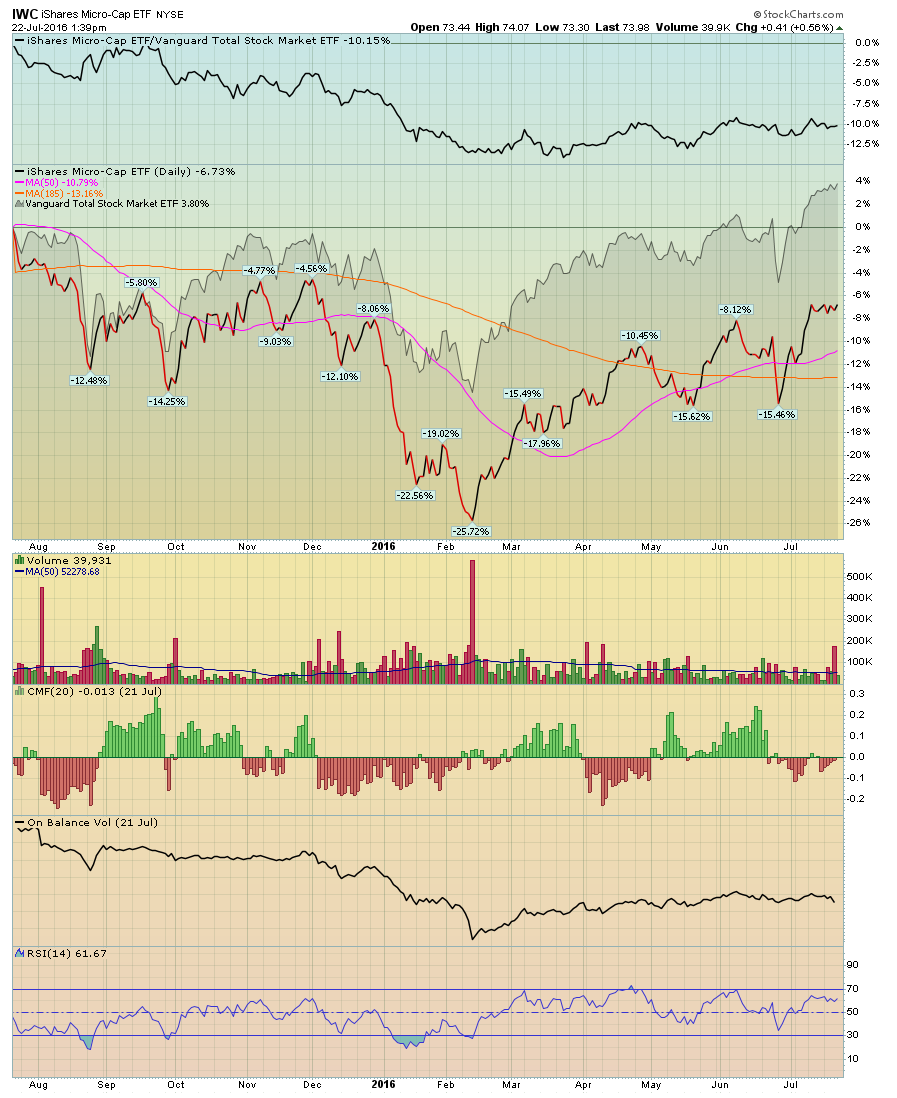
You’ll notice that once again we’ve added clarity by using the Verbose descriptions on all the charts. We’ve plotted VTI in the background in a low opacity gray scale so it’s easy to see if and when, for example, Micro-caps (IWC) are outperforming or underperforming the markets since both are plotted in price-performance mode (%). We have also made the type and size of the charts exactly the same. Using candlevolume can distort indicators on some charts making comparisons more challenging.
We’ve removed a few other indicators to help unclutter these 16 essential charts so they can speak to you more explicitly which we feel they do even better now.
 ChartList 217: Gold
Last quarter, we improved the charts on a number of equities in this list. This quarter, we are replacing FGLDX with IGDYX, and adding FSAGX while TGLDX remains for the mutual fund candidates. We add the iShares Gold ETF (IAU) which we prefer over GLD because the lower expenses do have an impact over time.
Fidelity Select Portfolio Funds (ChartLists 420 through 420-90)
Since the inception of the Tensile Trading ChartPack, we’ve tracked from quarter to quarter the portfolio holdings of over 40 Fidelity Select Portfolio Fund, carefully recording the stocks that move into and fall out of each fund’s top 10 holdings. With billions under management in each individual fund, these are the institutional “heavy hitters, the big leagues of the money managers. Diligently following changes in the stock selections of each fund has yielded powerful and profitable results for years, and this time around is no different.
This quarter, we’re excited to announce the addition of a new feature to the ChartPack. In addition to tracking each quarter’s new buys and sells, we are also now recording the total number of holdings for each Fidelity Select Portfolio Fund. We will be able to follow not only the total number of holdings, but also (more importantly) the changes to that number from quarter to quarter.
This is our first quarter tracking the total holdings figure for each fund, but it has already provided some unique insights. When we look at the totals, the average number of holdings in a Fidelity Select Portfolio is about 60 stocks. Some are more, some are less. The industry groups with the lowest number of holdings are generally more defensive: Automotive (22 stocks); Defense/Aerospace (28 stocks); Utilities (30 stocks). This makes sense. Lower volatility in those sectors allows managers to feel more comfortable with higher single-stock risk exposure. The industry groups with the highest holding totals, however, are quite the outliers. The Health Care fund, for example, has 109 total holdings. More astonishingly, the Technology fund has 231 total holdings, while the Biotech fund has a whopping 249 total holdings.
The important point here is this: if the big players in the money management game, the Fidelity Select Portfolio managers, are constructing a biotechnology fund that is composed of 249 different stocks, it tells you something quite clearly about the individual stocks in that industry group, the volatility of the industry group overall and the difficulty involved in trading it. On the other hand, if the Fidelity managers are comfortable holding just 22 stocks in an automotive portfolio or 30 in a utilities fund, it paints a very different picture of the stocks in those industry groups. Over time, it will be fascinating to track how these total holdings figures change from quarter to quarter and, perhaps most importantly, how they are affected by changes in a fund’s management team.
For now, here are a few highlights from the latest Fidelity buys and sells:
With continued uncertainty surrounding the Fed, interest rates, Brexit, and more, it’s no wonder that the banking-related funds continue to seem unsure of what to do. Goldman Sachs (GS), for example, dropped from the Brokerage / Investment Management fund’s top 10 holdings in the Q1, but that position was added back this past quarter.
Only 7 of the 41 Fidelity funds saw no changes to their top 10 holdings.
A hot and often controversial stock, Tesla (TSLA), appeared as a top 10 holding in the Technology fund in Q1. This past quarter, however, has seen some serious ups and downs for Tesla, ending with the recent concerns about the self-driving “autopilot” system after a fatal crash. Curiously, the stock is no longer a primary holding in the technology fund.
We noticed in Q1 that Public Storage (PSA) had been added to the Financial Services fund. That addition seems to have fallen out of favor with the managers, as the stock is no longer a significant holding for the fund. It’s always interesting to see a stock suddenly rocket up into a top spot in a fund, only to see a clear drop off in the position shortly after in the next quarter.
Trade well; trade with discipline!
- Gatis Roze, MBA, CMT
UPGRADE INSTRUCTIONS FOR EXISTING CHARTPACK USERS:
Important: If you have modified any of the charts in any of the ChartLists that start with “GR - ”, those changes will be deleted as part of the upgrade process. If you want to keep those changes, you need to copy those charts into a different non-"GR" ChartList before you upgrade!
To Upgrade the Tensile Trading ChartPack, follow these steps:
- Log in to your account and then click on the "Your Account" link in the upper right corner of the web page.
- Scroll down and find the "ChartPacks" area towards the bottom of that page.
- Find the entry for the "Tensile Trading" ChartPack in the table that appears. (If you don't see it, that means that you didn't purchase it - click here to purchase it.)
- Click on the "Re-Install" button next to the Tensile Trading ChartPack to start the reinstall process.
The download should take about 15 seconds. At that point, you can explore the new ChartLists and updates.
INSTALLATION INSTRUCTIONS FOR NEW CHARTPACK USERS:
If you are new and would like to add the Tensile Trading ChartPack to your StockCharts account, please Click HERE to get started.