 In one corner, you have investors. In the other corner, you have the stock market. When the two communicate accurately, you make money. Yes, it is that simple. Stay with me and I’ll make it worth your while.
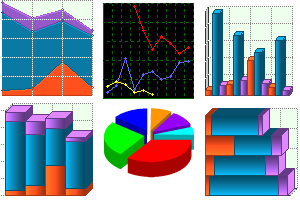
Investors, stock pickers, traders – pick a label – all sit somewhere along a dichotomist spectrum from fundamental analysis (based on earnings, sales, assets, liabilities) on one end to technical analysis (charts) on the other end. Personally, I prefer to more accurately label technical analysts as visual analysts. And yes, research in the academic community tells us that women are actually better in this area than men. I consider myself a rational analyst which simply means that I sit between both camps, utilizing the power of charts while keeping an eye on earnings.
It’s been my experience that the most adversarial debates I’ve had over the years with investors of another perspective has mostly been with staunch fundamentalists advocating the merits of their approach.
As a defense against this group of singularly myopic practioners of the dark arts, I developed ten reasons why technicals were superior. (I’ve written about these before in The Traders Journal and elsewhere). But I just came up with an eleventh reason. It’s the one I like the best.
Since I’ve decided to teach small group two-day investor boot camps in my personal trading office, I recently moved into a beautiful new space with a historic arched window measuring eleven feet tall by fourteen feet wide. Hey, I’ve earned it! There is a reason I’m telling you this.
Here’s the importance-of-communication part of this blog. I needed bigger shelves for the new office so I bought two lovely KALLAX units from IKEA. As most of you know, almost everything at IKEA comes in pieces with an assembly manual. It’s entirely up to you to figure out how to put it together correctly.
The parallels get uncanny between IKEA and the stock market. IKEA has over 12,000 products – similar to the stock market. IKEA operates globally in 48 different countries, not unlike the markets. IKEA (founded in 1943) is pretty popular with over 500 million website visitors and many billions in sales. Global stock markets are pretty popular as well.
The essential point I want to make here is how IKEA communicates with its customers. Over the past 73 years, the company has clearly figured out how to speak to its customers when they’re both in and out of the store. Let’s be candid – they’ve mastered the technique. So how they communicate should be of interest to investors as well.
The assembly manual for the KALLAX shelves is 20 pages long. The first six pages are legal warnings in 30 different languages and no doubt written by lawyers. The next 14 pages are wordless. Page after page totally void of written descriptions.
The genius of IKEA is that the company manages to communicate some complicated stuff entirely with graphics. In their world, visual communication transcends and replaces 30 different languages. My tongue-in-cheek point being that if the fundamentalists ran IKEA, the installation manual would be 20 pages times 30 languages or roughly 600 pages. Chalk one up for the visual camp.
Similarly, I submit to you that when you attempt to communicate with the stock market and understand precisely what it’s trying to tell you, the visual analyst wins. Hands down.
 Nice little mantra. Well done, IKEA.
In closing, I can’t help myself but to use a final example from the recent Olympics. In my years trading the markets, I’ve witnessed zillions of great companies with sensational earnings and fabulous fundamentals that never left the starting blocks.
It’s similar to having Usain Bolt at the starting line, but never firing the starter pistol. He goes nowhere. Yes, there’s lots of potential, but it’s not meaningful until he begins sprinting. Technical analysis measures price trends and visually announces to investors that the starter pistol has fired, the race is on and Usain Bolt is actually in running mode.
Now would be a good time to place your bets. In other words, visual analysis allows us to wait for Usain Bolt to leave the blocks before making a wager. I like those odds better.
Trade well; trade with discipline!
- Gatis Roze, MBA, CMT
- Author, Tensile Trading: The 10 Essential Stages of Stock Market Mastery (Wiley, 2016)
- Presenter of the best-selling Tensile Trading DVD seminar
- Presenter of How to Master Your Asset Allocation Profile DVD seminar
- Developer of the StockCharts.com Tensile Trading ChartPack