 This blog is in the new bi-weekly format where we’ll first analyze the charts I presented to you in my September 2, 2016 blog. After that, we’ll present new charts.
http://stockcharts.com/articles/journal/2016/09/charts-im-stalking-action-practice.html
As I wrote previously, this “Action Practice” only benefits you if you revisit the analysis you performed two weeks ago. At that time, you had no idea what would actually happen during the ensuing two weeks. So here’s my analysis done for you two weeks ago that you can now compare to your own effort.
- The first question I always ask is about the general market. Is it trending up, sideways or down? For those of you who have downloaded my ChartPack, you should simply review the three “Permission to Buy” ChartLists. It’s not only the go / no go decision you are looking to get, but the degree as well. In a strong up trending market, you would be inclined to allocate a larger dollar amount. Presently, my take is that the market is in a sideways pattern and could break either up or down. Until it shows it’s hand, I’m only willing to allocate a modest dollar amount.
- Your “Permission to Buy” ChartLists will also show you whether the market is favoring big cap, mid-cap or small cap equities, as well as Value versus Growth which will also play a role in your allocation decision and dollar commitment. Each of these are probability enhancers and add some wind to the back assisting the equity under consideration.
- You’ll notice that all three equities are from the Technology Sector. My review of the PerfCharts plotting all nine Sectors showed XLK to be the most attractive for the particular timeframe I like to trade. Timeframes are very personal. Every investor should nail that down before investing big money. Investing timeframes are whatever you find personally comfortable.
- Once the sector has been chosen, we do a similar analysis. In this case, we analyze all eleven Dow Jones Industry Groups that comprise the Technology Sector. I found the US Semiconductors ($DJUSSC) to be the most attractive.
- Then I dug into this industry group (eliminating stocks under $1 - simply check the box on that screen) and then only considering stocks above $10. It’s a personal preference of mine to look for stocks trading above $10 because many institutional buyers are not interested in equities below that range. What I just described is all easily achieved with simply a few clicks, starting on the StockCharts.com home page, but this blog won’t get into those mechanics. We’ll leave that for a later date.
- The result of these investigations led me to the three options I presented to you on September 2, 2016. I’ll review Silicon Labs (SLAB) first, as I included this to illustrate an Investor Self lesson. First, the layout you see in the SLAB chart is easily produced by simply pulling down the “Chartstyles” menu and looking for my name “Gatis Roze”. This generates the chart quickly and easily, showing the following:
- How SLAB is performing relative to the market (VTI). Compare this graph to your other two candidates.
- The next chart shows how the Technology Sector (to which SLAB belongs) is behaving relative to VTI. This graph looks the same for all three candidates since they all belong to the same sector. It’s clear that technology is a very strong sector.
- The third chart below shows how the Semiconductor Industry ($DJUSSC) is outperforming its Technology Sector. This, too, is the same for all three of our candidates. Remember that the stock market operates on the Law of Groupings. The group to which your equity belongs matters a lot.
- The fourth chart plots SLAB’s performance versus its brothers and sisters in its own semiconductor industry.
For a moment, let’s simply compare Intersil Holdings (ISIL) with SLAB on these four graphs. To me, it’s clear that ISIL is the winner here. The winds of probability are clearly blowing more strongly at ISIL’s back. Returning to my comment about why I included SLAB in the mix. I have a lot of emotional baggage and history with Silicon Labs. I doubled my money on a position years ago, and as a consequence, I must acknowledge that I see it through rose-colored glasses. My judgement and clarity is impaired. I know this. That is not to say that I would never buy it again, but because of that fact, I require higher probability winds than I would for another candidate.
In this example, I pick ISIL over SLAB for other reasons. I like both the money flow and the breakout volume on the ISIL chart better than on the SLAB chart. Notice on the ISIL chart how volume dries up on the pullbacks and down days after it breaks out to a new high. In addition, ISIL has a nice base, with a couple of shakeouts prior to the breakout, as well as an attractive P&F chart. (Those of you who are Wyckoff devotees know what I mean.)
Now let’s consider PSI. One method I like to use when stalking, buying, monitoring or selling ETFs is to look closely at their top 5 or so holdings. In the case of PSI, it would be helpful to review the individual charts of LLTC, NVDA, TXN, INTC and AMAT. PSI is an ETF basket of 30 semiconductor companies which Powershares assembles based on a proprietary methodology. It’s a perfectly reasonable alternative that has actually outperformed ISIL by a wide margin over the past seven years. It gets back to the issue of what is your personal timeframe. PSI would be a better choice for longer term investors, but I prefer ISIL as a trade on September 2, 2016.
The other key questions that must be answered are of a personal nature as well. Therefore, I can only present the issues and you must look to yourselves for the answers.
- Where would you place your stops for each candidate?
- How much do you plan to buy as a percentage of your model position (ladder in)?
- How will this purchase impact your asset allocation model?
- How does it fit within your methodology? I check my own “Battle V” methodology.
My “Battle V” methodology is checked to see if ISIL fits the bill. So what was the bottom line on your “Action Practice” exercise?
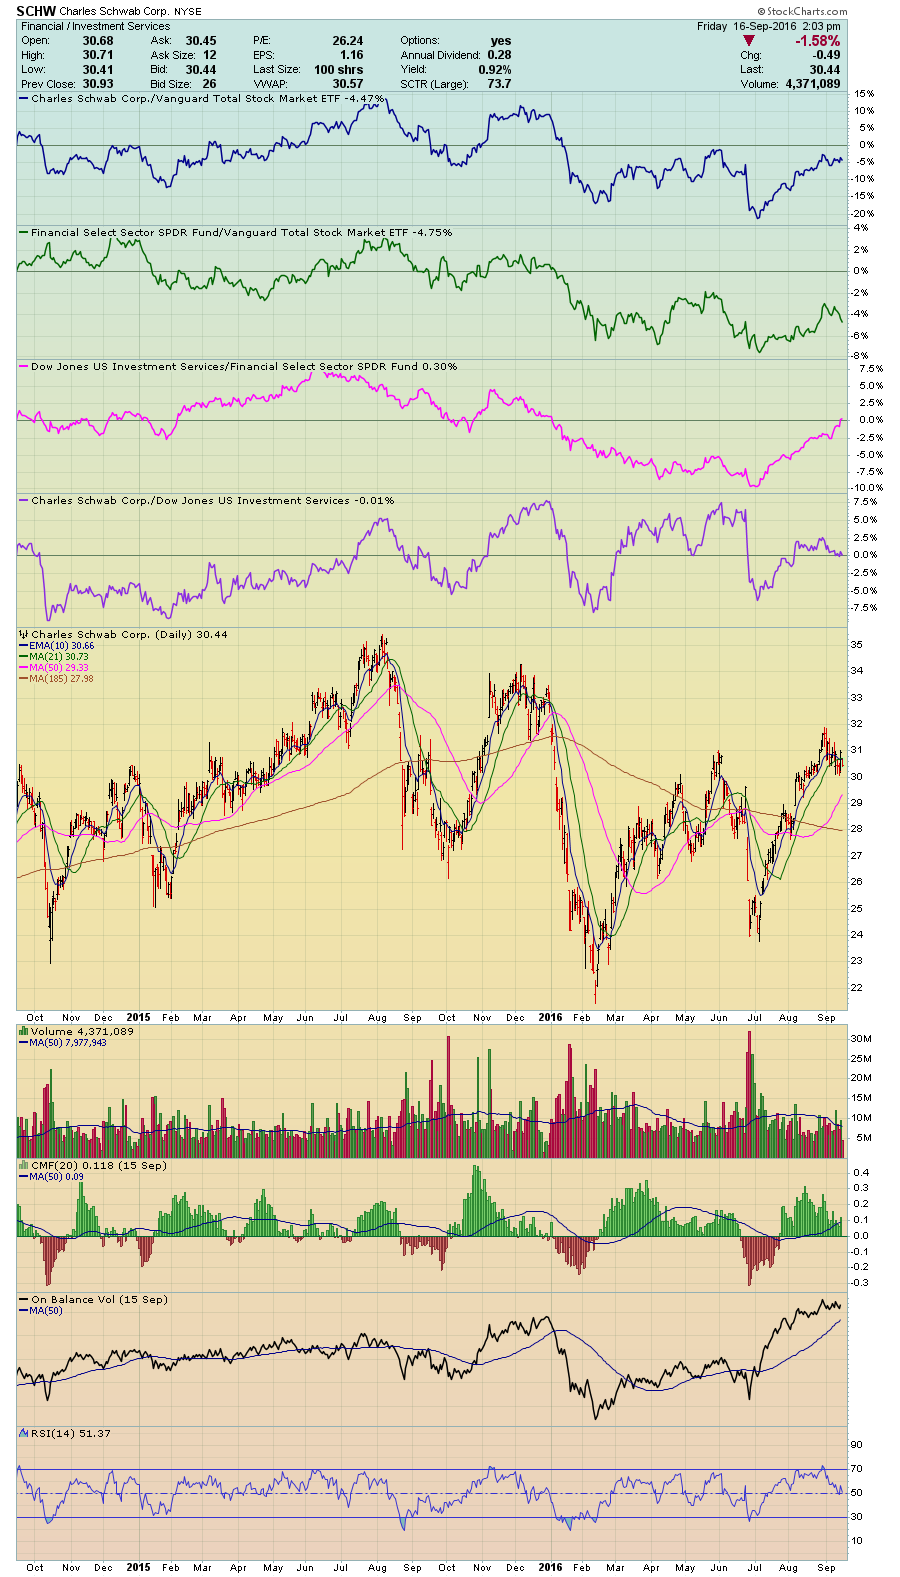
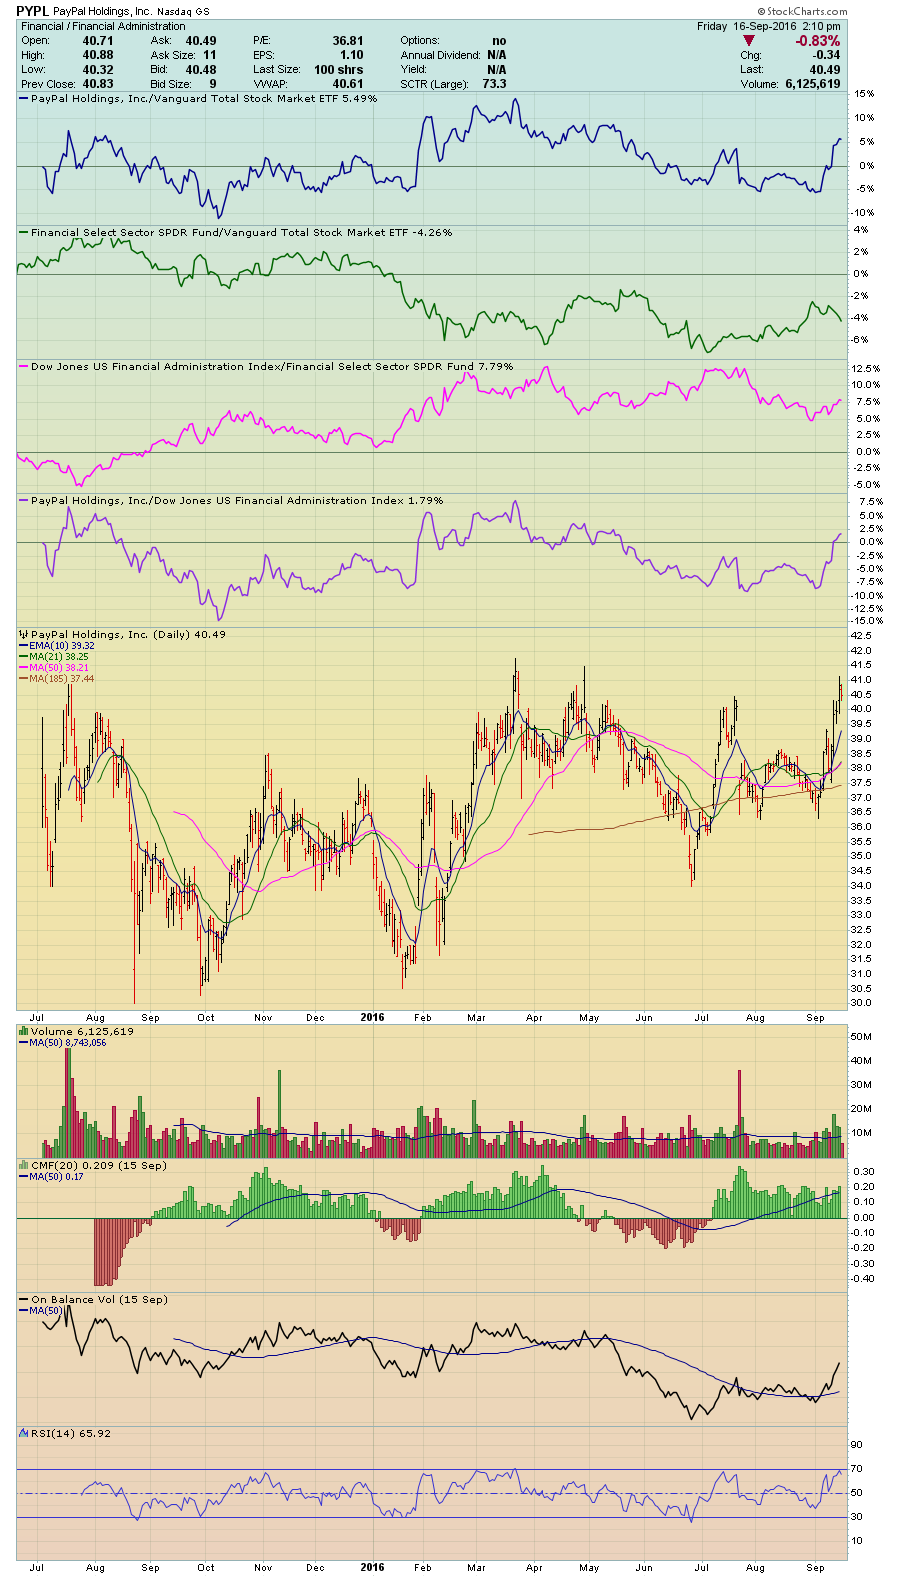
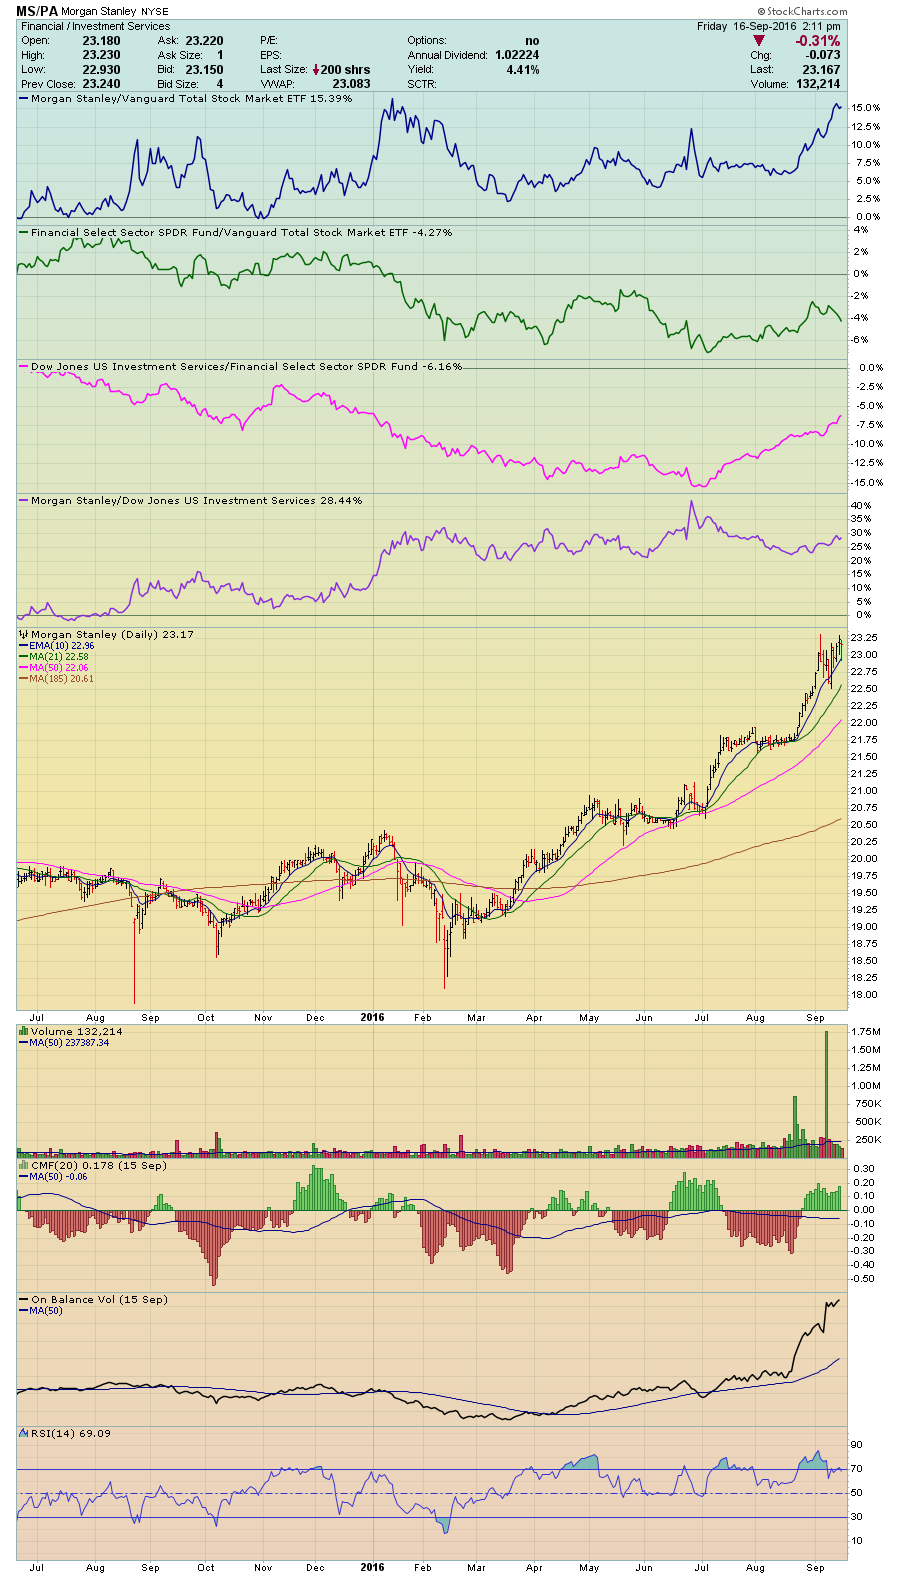
Here are the Action Practice charts for this week:
Trade well; trade with discipline!
- Gatis Roze, MBA, CMT
- Author, Tensile Trading: The 10 Essential Stages of Stock Market Mastery (Wiley, 2016)
- Presenter of the best-selling Tensile Trading DVD seminar
- Presenter of How to Master Your Asset Allocation Profile DVD seminar
- Developer of the StockCharts.com Tensile Trading ChartPack