RRG Charts August 24, 2015 at 08:26 AM
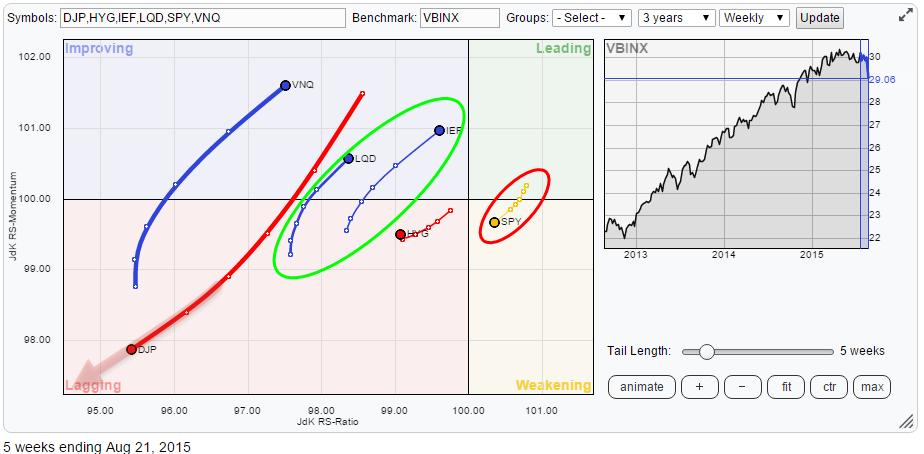
Wow, there's a lot going on in the markets and some big shifts seem to be under way in asset class rotation as well as in (international) equity markets rotation. Relative Rotation Graphs may help you get a handle to put all this movement into (relative) perspective... Read More
RRG Charts August 15, 2015 at 07:30 AM
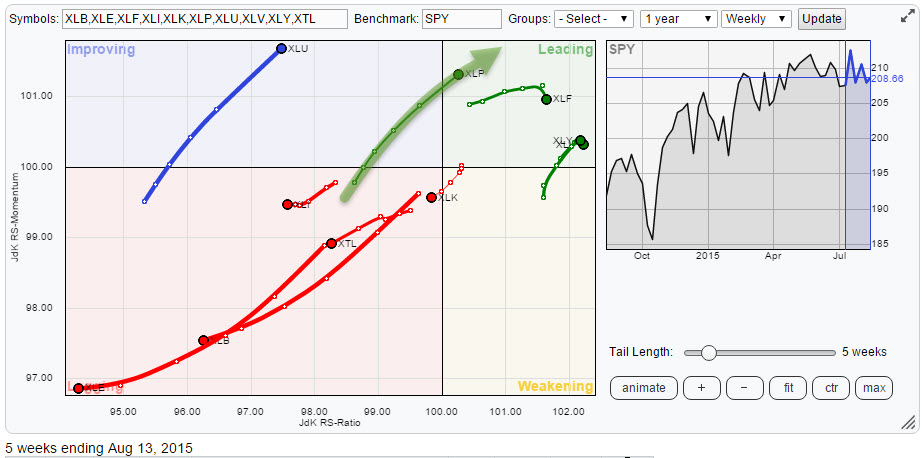
The top-level Relative Rotation Graph holding the nine S&P sectors clearly shows you which sector rotation is in play at the moment. If I look at the rotation of the various sectors on this RRG chart, XLP, the Consumer Staples Sector, is catching my eye... Read More
RRG Charts August 05, 2015 at 02:31 PM
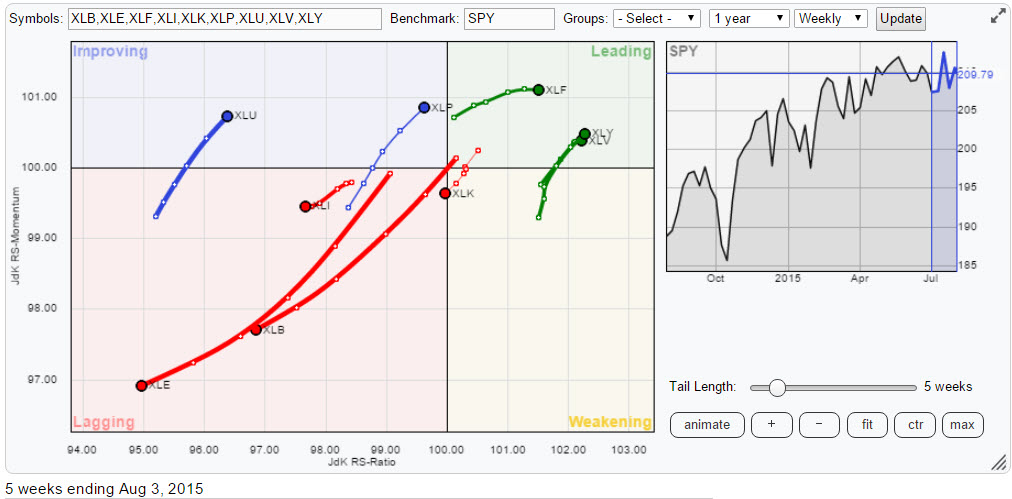
One of the subjects covered in this blog on a regular basis is the relative rotation (sector rotation) in the US equity market. The data, ticker symbols, that I use for the analysis are the nine ETFs from the SPDRS family, provided by State Street Global advisors... Read More