Summary
- Information Technology standing out in S&P universe
- Weak rotation for HPQ, SYMC and IBM
- MU not expected to reach leading quadrant
- NVDA, ATVI and FIS show stable relative uptrends
- Opportunities for INTC, SNDK and MSFT
Information Technology positioned for strong sector rotation
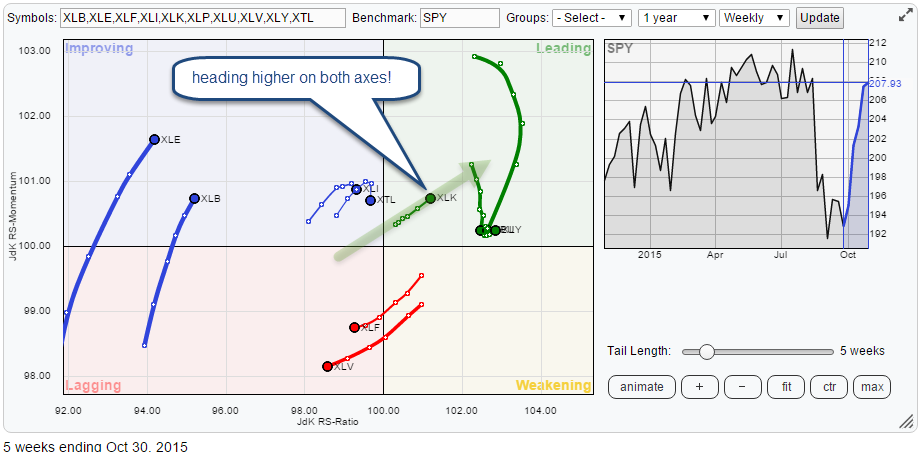
My previous article already highlighted the Information Technology sector as one of the stronger sectors inside the S&P universe. The updated Relative Rotation Graph on a sector level (using ETFs) shows that this positive rotation is still working out well and that XLK continues to head further into the leading quadrant, indicating a positive relative trend versus the S&P 500 index (SPY).
The positive analysis on XLK still stands and only got confirmed by last week's price action
Initial observations
In this article, I want to take a look at the rotational patterns for a number of stocks inside the Information Technology sector.
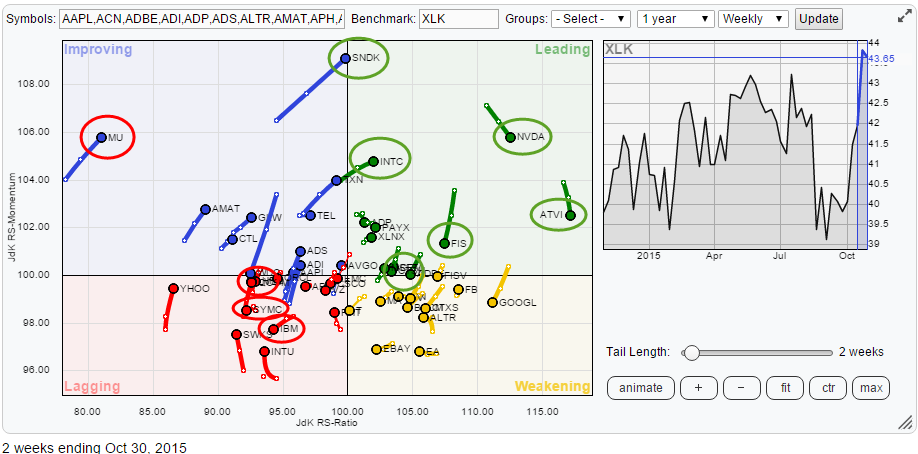
The starting point is the Relative Rotation Graph at the top of this post holding the top-50 constituents of the Information Technology sector based on market cap. The total number of holdings in the ETF is 75 with the top ten counting for well over 50% of the total market capitalization for this sector.
A quick scan of the RRG points the attention to a number of stocks that are (moving) away from the center (=benchmark) of the chart. These always deserve some love from an analyst as they stand out from the crowd, either positive or negative and often offer potential from a trading or investment perspective. I have highlighted these ticker symbols in the green and red circles.
After having identified the "easy ones," I start to zoom in and out of the RRG to see if there are any other ticker symbols that are showing an interesting rotational pattern. Especially when an RRG is crowded, like in the example above, it is possible that stocks which are rotating completely on the right or completely on the left-hand side of the chart are hidden in the clutter. In this case, that happens with one stock on the right-hand side, MSFT, and one on the left, HPQ.
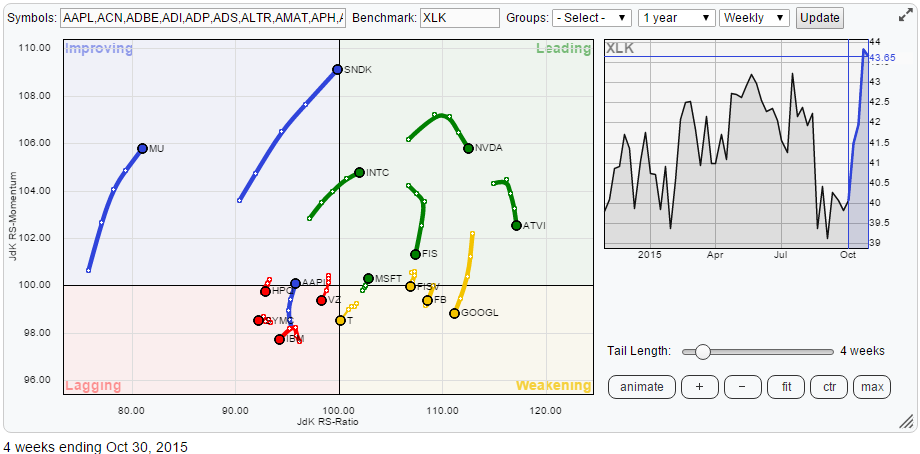
After highlighting the symbols that need some extra attention, I have cleaned up the RRG to hold the mentioned stocks for better visibility and left some of the big names in there for reference purposes as you can see below.
Lagging quadrant
Inside the lagging quadrant, there are three stocks begging for attention. These are IBM, SYMC and HPQ. The difference between them is the way in which they reached their current position. IBM moved into the lagging quadrant after having travelled from leading, through weakening while HPQ and SYMC were inside the lagging quadrant already, then moved higher into the improving quadrant but then rotated back into lagging. In other words; IBM just started a new relative downtrend while HPQ and SYMC are resuming their existing relative downtrends.
International Business Machines - IBM
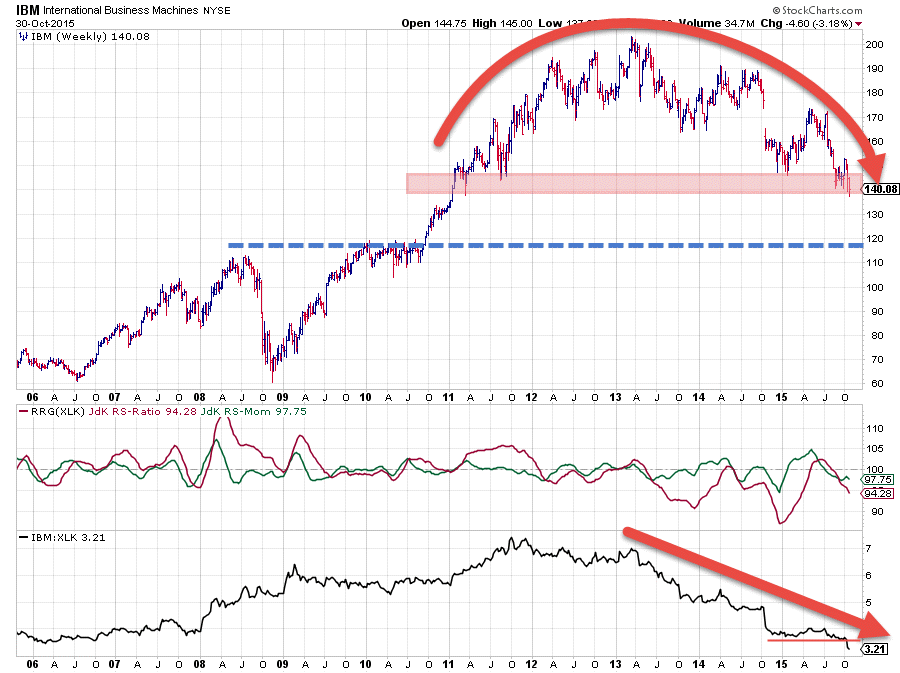
The chart of IBM above is showing a big rounding top where the price is just trying to find support near $140. The series of lower highs and lower lows is clearly visible and there are no signs for a quick reversal in sight. When support near $140 gives way the next serious support level is only found near $120.
From a relative perspective, things are not looking much better. The raw RS-line in the lowest pane shows a declining trend since the beginning of 2013. Things started to look a little better at the start of this year when relative strength started to move flat causing the RRG lines to pick up and briefly pushing the JdK RS-Ratio above the 100-level. At the beginning of September, the RS-Ratio already dropped back below 100 again suggesting the start of a new relative downtrend. This move has recently been confirmed by the RS-line breaking below the horizontal support level.
Despite the strong outlook for the sector as a whole, this does not apply to big blue!
Hewlett-Packard Co. - HPQ
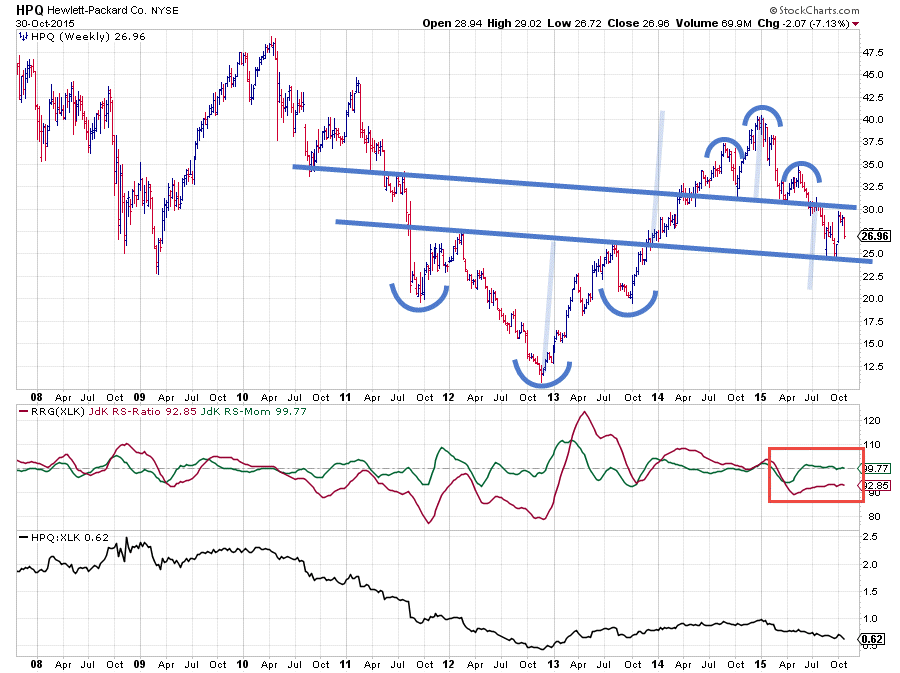
From a relative point of view, HPQ is in a downtrend already since the beginning of this year when both the JdK RS-Ratio and the JdK RS-Momentum lines dropped below 100. After the initial drop, RS-Momentum started to recover a bit and managed to get back to levels around 100 while RS-Ratio remained low. Such a behaviour indicates a stable relative downtrend that gradually continues to move lower. Which is what we see in the Relative Strength graph itself. Zooming in on the RS-graph will show you a steady pattern of lower (relative) highs followed by lower (relative) lows.
The price chart, however, is showing some interesting patterns. First of all, there is the big H&S bottom formed in 2011-2013. The break of the neckline late 2014 triggered the rally that took HPQ to the high near $40. That high turned out to be the "H" of another H&S pattern (top this time), formed from mid-2014 to mid-2015. Interesting to see is that the neckline of this H&S top is running parallel to the neckline on the previous H&S bottom. The neckline of the H&S top was broken downward in July and this triggered a follow through decline towards the latest low at $25 which happened to be right on the support offered by the former neckline of the H&S bottom... The market seems to like these levels. The move from $25 back to $30 seems to qualify as a pull-back which means that more downside can be expected for HPQ.
$25 or slightly lower (slightly falling support level) looks to be the level to watch. When broken downward another acceleration lower may be expected. All in all, there is little reason to believe that the relative strength for HPQ will improve anytime soon. There are definitely better opportunities to be found inside the sector.
Improving quadrant
In the top-left, improving, quadrant I have highlighted two stocks, MU and SNDK but they show completely different rotational patterns with completely different conclusions.
Micron Technology Inc. - MU
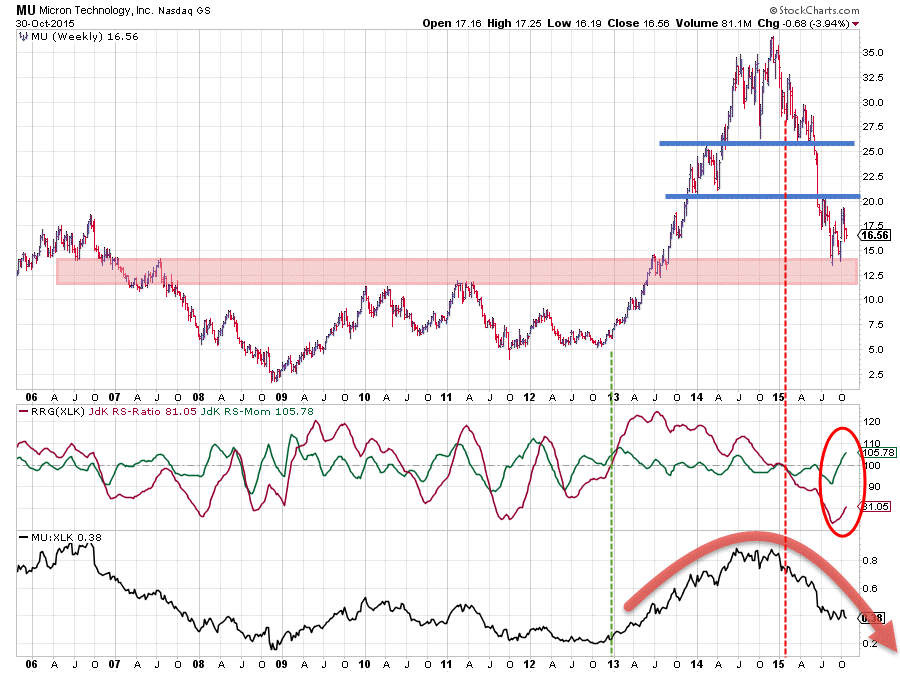
What a difference a year, or two, makes! The big move for MU on both the relative- and the price- charts started at the beginning of 2013. Price moved from $5 to $35, not surprisingly backed by a very strong relative move. The RS-Ratio crossed above 100 late 2012 after the RS-Momentum line had done that already a few months earlier. During the whole move, the RS-Ratio line stayed well above this 100 level while RS-Momentum oscillated around 100 in a small range, indicating a stable trend. Towards the end of 2014 the loss of relative momentum started to increase and finally the relative trend turned around at the beginning of this year (2015).
The relative downtrend accelerated lower for the better part of this year and only recently RS-Momentum started to pick up and managed to pull itself above 100 again. The problem is that RS-Ratio is so far below 100, i.e.the relative downtrend is so strong that it is very unlikely that the current strength in relative momentum will be able to turn the weakness around.
On the price chart, a big support zone is visible centered around $12.50. Given the strength of the sector, I would expect this support level to hold up for the time being and thus catch any new drops in price. However, much more upward price action will be needed to help turn the relative trend around again. It looks like one more rotation on the left is needed for MU before it will be able to hit the leading quadrant again.
Sandisk Corp. - SNDK
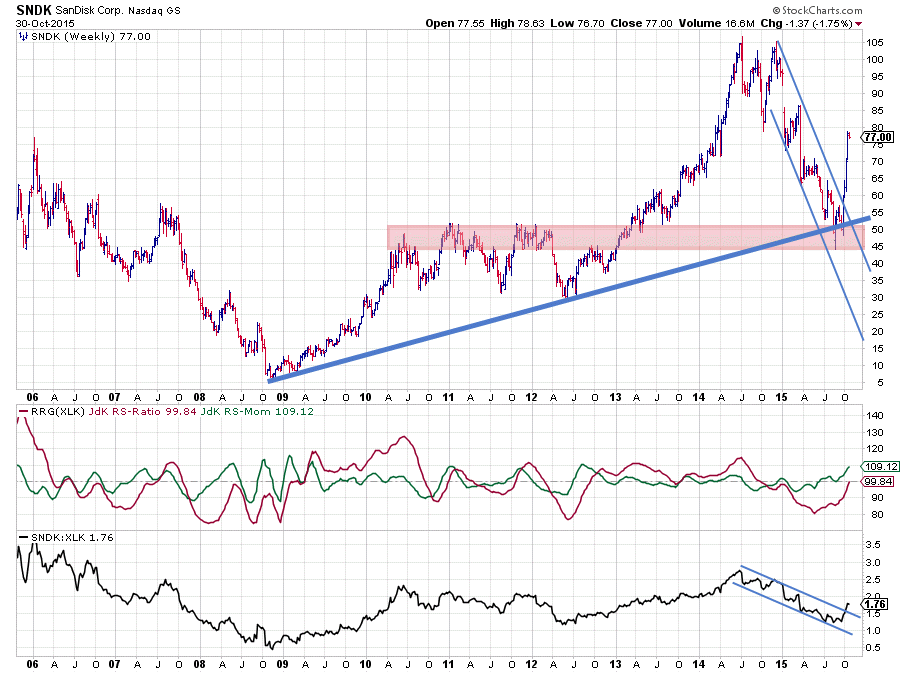
A completely different picture is painted by the chart of Sandisk, at least from a relative perspective. The levels of the RRG-Lines against XLK cause SNDK to show up at the highest position on the RS-Momentum axis and on the verge of crossing over into the leading quadrant. The upward break of the RS-line out of its falling channel backs the indication (RS-Ratio above 100) that a new relative uptrend is about to get underway.
The price chart shows similarities with the price chart we have seen above for MU. A break above a major horizontal resistance area, in this case, at the beginning of 2013, followed by a strong rally to a new peak and then a strong downtrend back to the former breakout level acting as support. SNDK then jumped higher off of this support area and rallied strongly while breaking the rhythm of lower highs and lower lows. It is this recent rally in price that is pulling relative strength higher at the moment. The strong RS-Momentum is expected to continue to pull the RS-Ratio line higher adding strength to the new relative trend.
This makes SNDK one of the stocks inside the universe offering opportunities to participate in the emerging relative move against XLK. The steep rise on the price chart can cause a short-term setback to digest the rally but, all in all, such a setback is likely to be a buying opportunity at lower price levels.
Leading quadrant
In this quadrant, we find INTC still relatively low on the JdK RS-Ratio scale but heading higher on both axes causing a positive angle pointing further into it. Refer to the Intel (power) inside article from 12 October for an analysis of the INTC chart which is still valid today.
NVDA, ATVI and FIS are highlighted on the RRG as being in stable uptrends against XLK. Despite their current loss of relative momentum, all three are still in solid relative uptrends. The price charts of FIS and ATVI are in solid uptrends and still powering higher and pushing to new highs. The chart of NVDA is slightly different and seems to be offering the best opportunities in terms of risk/reward.
MSFT is just rotating back into the leading quadrant from weakening which means that a temporary loss of relative momentum has come to an end.
NVIDIA Corp. - NVDA
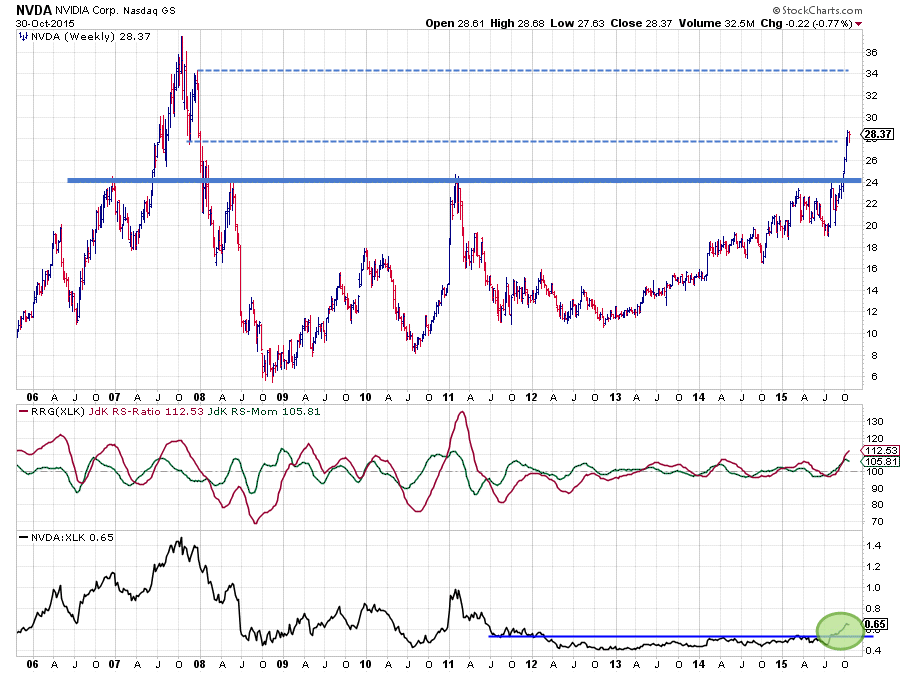
The uptrend in NVDA, which is still in play on the price chart, started at the beginning of 2013. The oscillations of the RRG-Lines closely around the 100-levels, until a few months ago, indicate a relative movement in line with the performance of XLK. This changed in the second half of September when the relative strength line broke above a four-year horizontal resistance level following a break higher on the price chart where NVDA pushed above a major barrier at $24 which had been in place since early 2008 and which also lines up with a major high from December 2006.
$24 should now act as a solid support level below price in coming months which puts in a good floor and limits the expected risk for this stock. The drop in relative momentum at this moment is expected to be temporary in nature and result in a rotation on the right-hand side of the RRG. A drop in price, back to support near $24?, should offer good possibilities for a new move higher.
Microsoft Corp. - MSFT
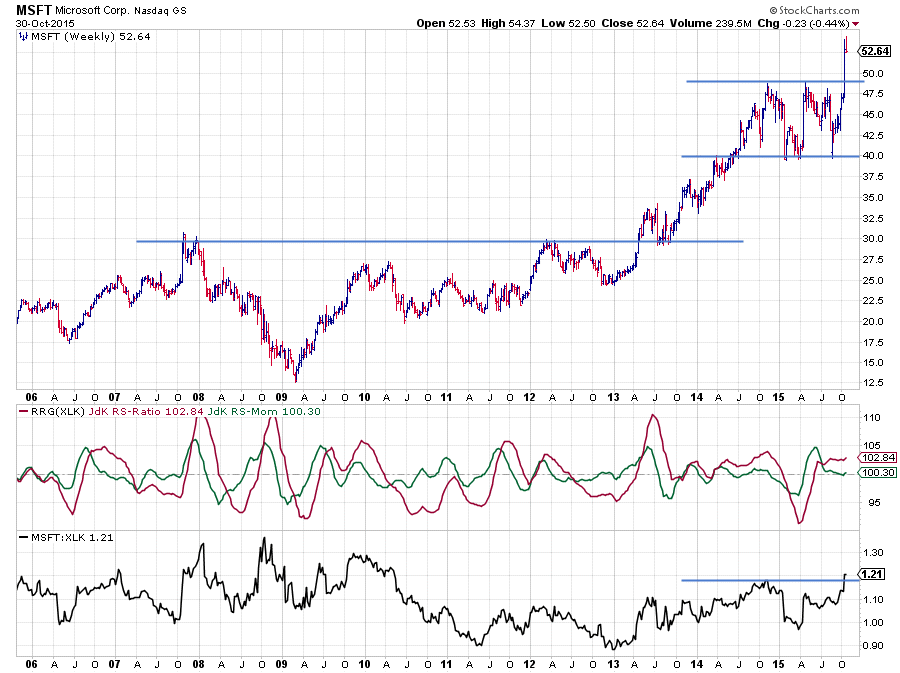
Microsoft just rotated back into the leading quadrant after a very short stint through weakening. After an initial jump above the 100 level in April-May, the RS-Ratio is now moving steadily above the 100 mark over the past few months. The RS-Momentum line dropped back to 100 and has been flat. This causes a very short trail on the MSFT ticker symbol on the RRG-chart which signals stability.
The break above the most recent high on the RS-line opened up the way for more relative upside that can push the RS-Ratio to a higher level in coming months. The price chart is providing the necessary ammunition for this to happen. After a strong rally in 2013 and 2014 this year, for the better part of it, was characterized by a broad trading range between $40-49. Two weeks ago the jump in price pushed beyond the upper boundary of this range triggering a new buy signal and a continuation of the trend. This means that drops back to the breakout level can now be seen as new entry opportunities to participate in a new move higher.
Julius de Kempenaer | RRG Research
RRG, Relative Rotation Graphs, JdK RS-Ratio and JdK RS_Momentum are registered TradeMarks by RRG Research