 The Relative Rotation Graph above shows the sector rotation for ten US sector ETFs. The new REITs sector ETF is not included yet due to a lack of historical data points.
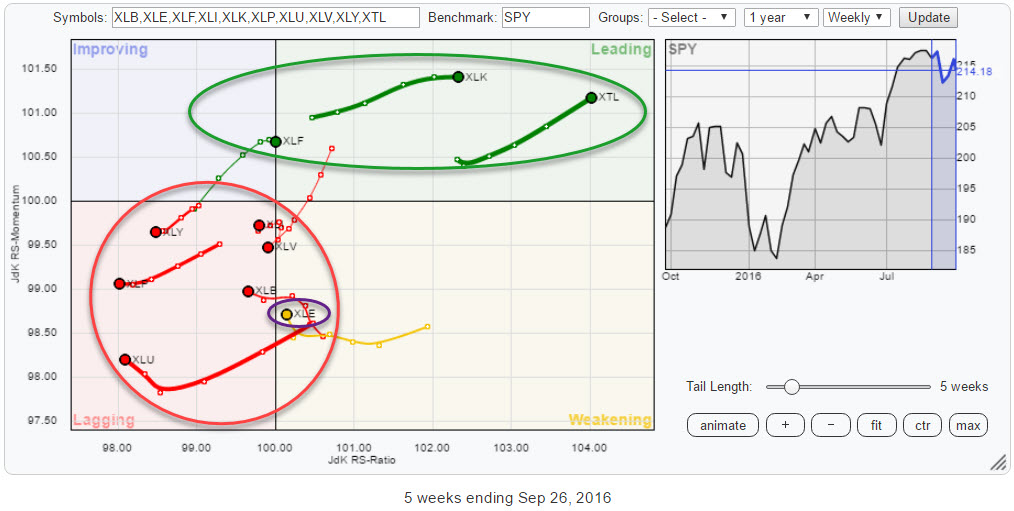
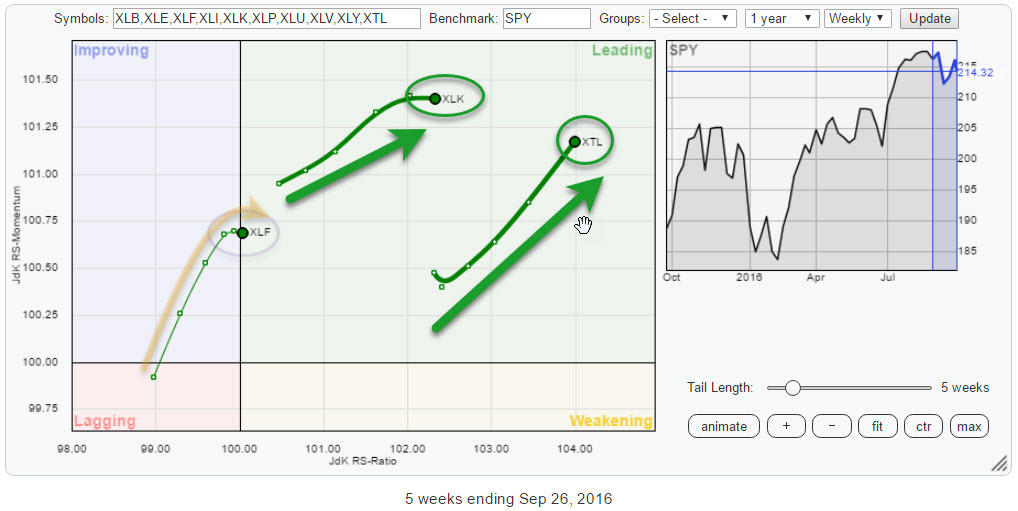
The immediate catch on the RRG above is the separation of XLK and XTL in the leading quadrant while most other sectors are on the left-hand side of the 100-level of the JdK RS-Ratio axis.
Six sectors inside, or just rotating into, the lagging quadrant, does not get me very excited about the potential for the S&P 500 itself.
Summary
- Lagging quadrant is crowded
- XLY and XLP both set to weaken further in coming weeks
- Rotational pattern for XLV points to weakness ahead
- XLK (and XTL) only sectors well inside leading
- XLF needs to hold above neckline to avoid rapid deterioration.
- Pick-up of relative momentum in XLE is rapidly needed to rotate sector into leading quadrant.
- 6/10 sectors inside the lagging quadrant do not bode well for general market direction.
Quick scan
As said above, the initial look at the RRG above does not make me very happy concerning the general market condition.
Six out of the ten sectors on the chart are moving inside the lagging quadrant or about to rotate into it. These sectors are XLI, XLV, XLI, XLP, XLB, and XLU.
XLE is inside the weakening quadrant and very close to the 100-level on the JdK RS-Ratio axis but just started to pick up some relative momentum again which could steer it higher up the RS-Momentum axis and make the Energy sector turn upward again before hitting the lagging quadrant or shortly after entering it. But it has to happen fast to make it work. So this will be an interesting rotational pattern to watch in the next week or 2.
On the positive side, we only have XLK and XTL doing well inside the leading quadrant. Both sectors are well inside positive territory and generally heading higher on both axes.
The last sector is XLF which is inside the leading quadrant, albeit only just, and the problem here is that the last three observations on the tail are very close together, indicating that there is not a lot of power (momentum) behind this move.
The (crowded) lagging quadrant
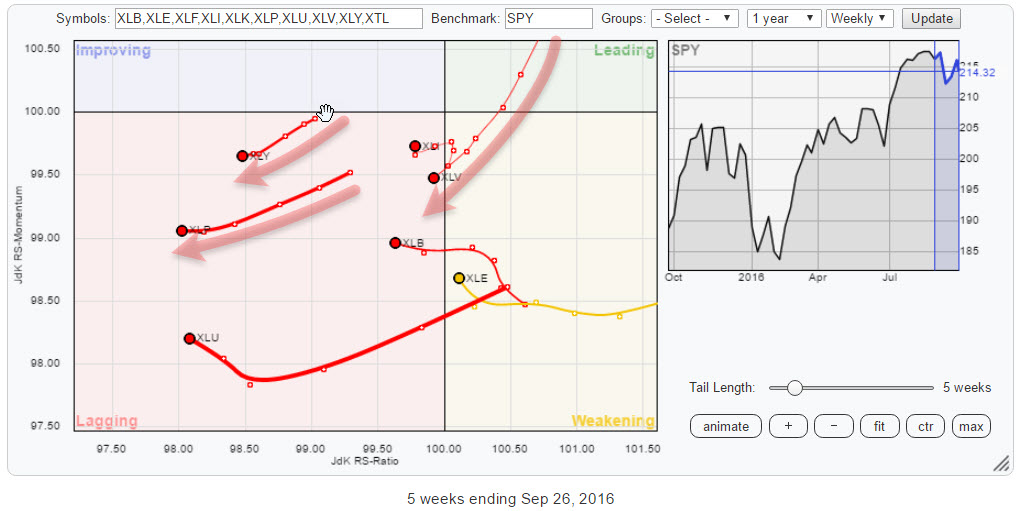
The RRG above shows the rotation of the sectors inside the lagging quadrant in more detail.
As you can see XLY, XLP, and XLV are still working their way lower on both axes while XLI, XLB, and XLU have managed to pick up some relative momentum lately which makes them move higher on the RS-Momentum axis.
The overall outlook for these sectors, in general, is still negative from a relative point of view.
The weakest three are highlighted below, including their charts.
Consumer Discretionary- XLY
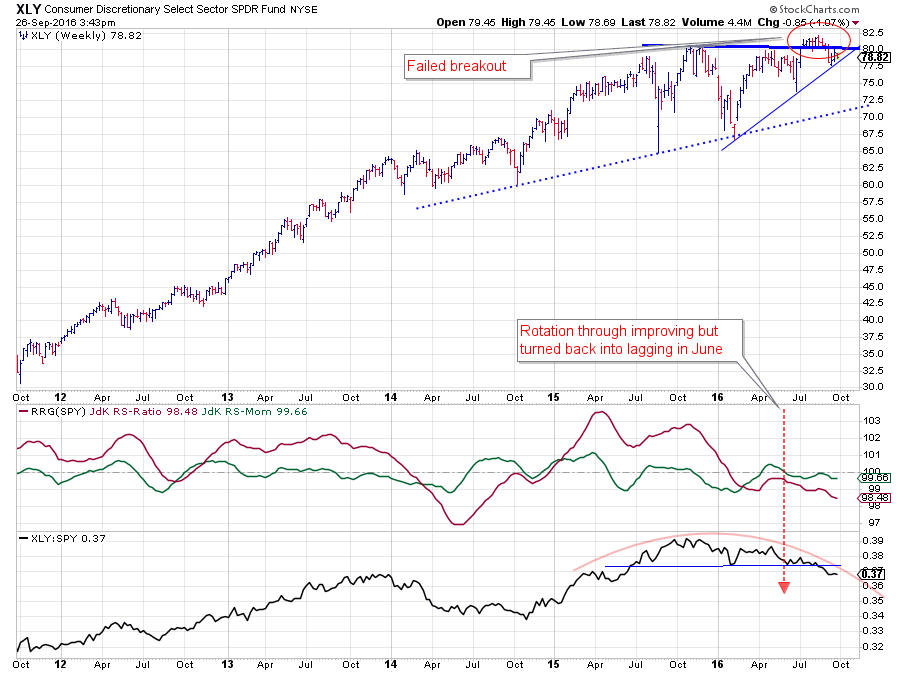
The consumer discretionary sector is usually one of the sectors you can look at to determine if the general market is in a risk on or risk off modus.
The weak relative strength charts are clearly calling for a risk-off condition for the general market.
The RRG Lines, especially the JdK RS-Ratio, already turned below 100 back in February. Since then we have seen one short rotation through improving and then back to lagging, and very recently we saw another attempt to push into the improving quadrant but that failed, and the sector rotated backward without even hitting the improving quadrant.
The raw RS-Line confirms this renewed weakness as it has now clearly broken below its horizontal support level and seems to be headed for lower levels in coming weeks.
Until a few weeks ago the price chart was sending some mixed signals in combination with relative strength as it broke above resistance which improved the outlook for the chart. However, the expected rally never materialized, and XLY dropped back below its breakout level which caused a "failed breakout" which is actually a negative signal.
At this point in time, Consumer Discretionary looks to weaken further in coming weeks from both the price- and the relative charts.
Consumer Staples - XLP
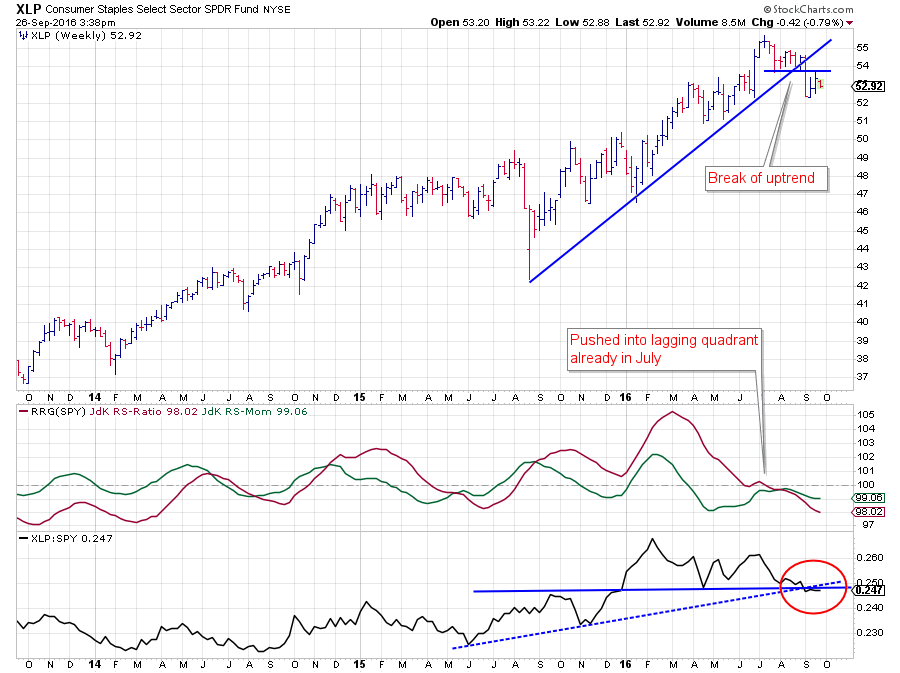
“Normally” … if that still exists, Consumer Staples would be expected to move more or less opposite to Discretionary. But as you can see in the chart above XLP has also started to show weak relative strength over the past few months.
This puts both Discretionary and Staples inside the lagging quadrant, and both are showing a negative heading that takes them lower on both axes.
The RRG-Lines are both well below a 100, indicating that a relative downtrend is underway. The raw RS-Line is about to break below double support, coming off the horizontal line that connects a previous high and low, as well as the rising support line that connects the lows back in 2015.
On the price chart, the rising support line, out of the 2015 low has been broken, and a new series of lower highs and lower lows seems to be getting underway.
Just like discretionary, it looks like Staples are headed for a period of underperformance in coming weeks.
Health Care - XLV
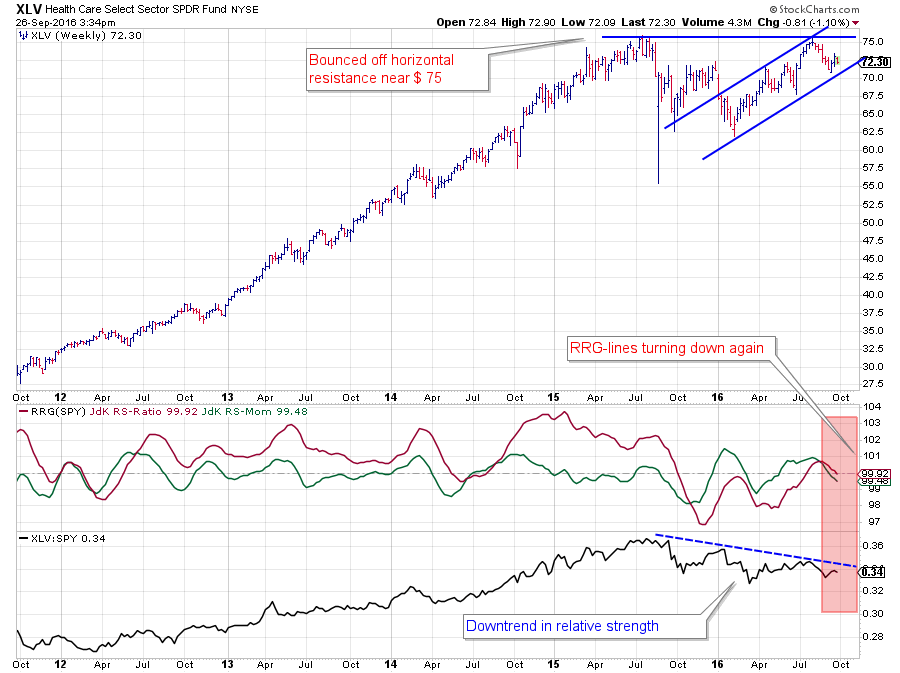 Health Care is probably the sector with the biggest negative “potential.” XLV has just rotated through the leading and weakening quadrant and is now entering the lagging quadrant.
The recent positive rotation was very short and got triggered by the flat to rising RS-line from April to July that did not make it past the falling resistance line which is running lower over the last three major highs in relative strength.
On the price chart, XLV has just bounced off horizontal resistance near $ 75 (2015 peak) but is still inside its rising channel.
With no support from relative strength, XLV will have a hard time breaking that $ 75 barrier. If on the other hand, the rising support line gives way, risks to the downside will increase rapidly. Given the rotational pattern, I am biased to the latter scenario.
The (less crowded) leading quadrant
As pointed out above the leading quadrant is a lot less populated than the lagging. XLK is the most important sector moving deeper into this leading quadrant. XTL is doing well, but it’s a very small sector which will not have a lot of impact on general market direction.
Financials, XLF, on the other hand, is an important sector, and it is on the verge of rotating into the leading quadrant.
The one thing that is raising some doubts about the rotation of Financials is the shortening of the tail over the past few weeks while at the same time losing some relative momentum where you would like to see a powerful, backed by relative momentum, move into the leading quadrant.
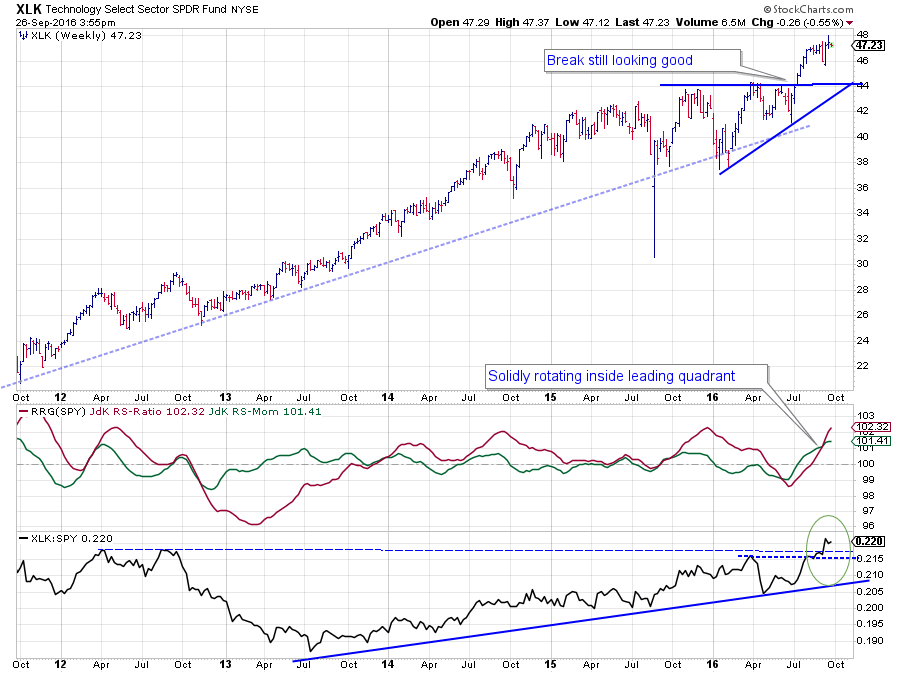
Technology - XLK
Without a doubt, Technology is, together with Telecom, the best sector in the S&P right now.
On the price chart, XLK broke above its horizontal resistance in July, and immediately rallied higher. It’s this sort of follow through that makes for a reliable breakout.
The old $ 44 resistance level is expected to return as support in case of a setback.
On the back of the break higher in price, relative strength got refueled. Looking at the raw RS-Line, an uptrend can be detected coming out of the 213 low which has been working its way higher ever since.
Compared to the S&P 500 and the other sectors in the universe, using the RS-Ratio, XLK has been going back and forth a few times. The April-May dip in relative strength caused a complete rotation through all quadrants but recently the sector pushed into the leading quadrant powerfully.
With XLK’s relative strength breaking above its important previous high dating back to 2012 and price above its previous highs, XLK looks set for a further progression into the leading quadrant.
Financials - XLF
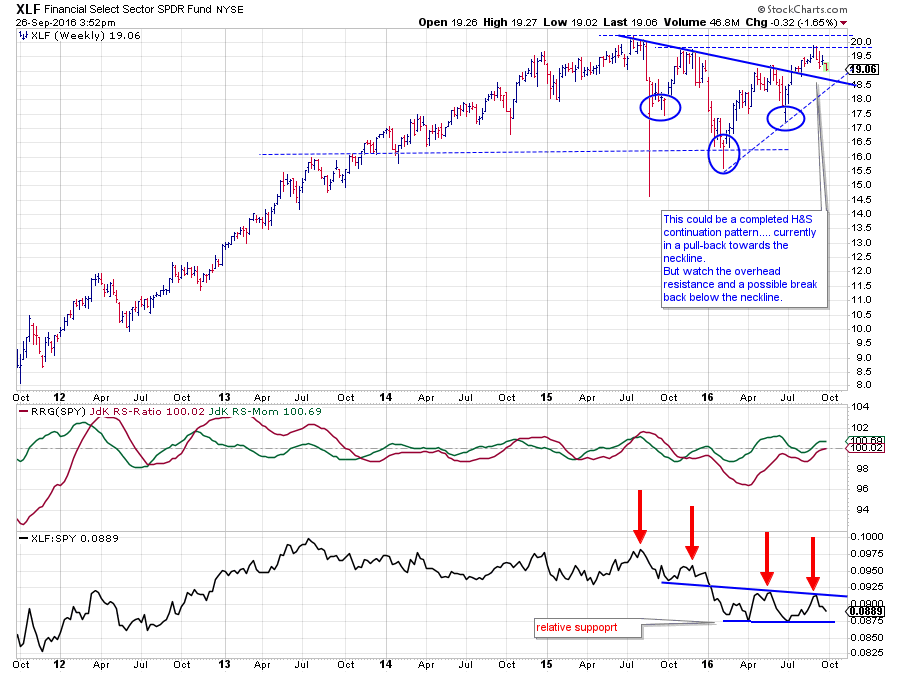
XLF has been trending down on the RS-chart since the second half of 2015 after a long sideways period during 2014. As you can see in the chart above all recent major highs in the RS-Line, have been set at lower levels.
The last high almost reached the level of the previous relative high, indicating improvement. In combination with the past two relative lows coming in around the same level, RS looks to be moving sideways now. In other words, indecisive.
But it was enough to bring the RRG-Lines up and above the 100-level positioning the sector just inside the leading quadrant.
At the same time, RS-Momentum is already leveling off, taking away the momentum from the RS-Ratio line. This raises some doubt about the potential for Financials to rotate deeper into the leading quadrant at this point in time.
The catalyst for a further improvement in relative strength will have to come from the price chart. A few weeks ago an H&S continuation pattern seemed to have completed, sending prices higher.
Only it happened just to a limited extent. After breaking the neckline XLF rapidly ran into overhead resistance in the $ 20 range and has now started to pull back towards the former neckline.
As long as this former neckline holds up as support there is a good chance that price will be able to pull XLF deeper into the leading quadrant. If the neckline does not hold up and price falls back below it, that will be a negative signal and it will very rapidly turn things around for XLF.
The odd one out
Energy - XLE
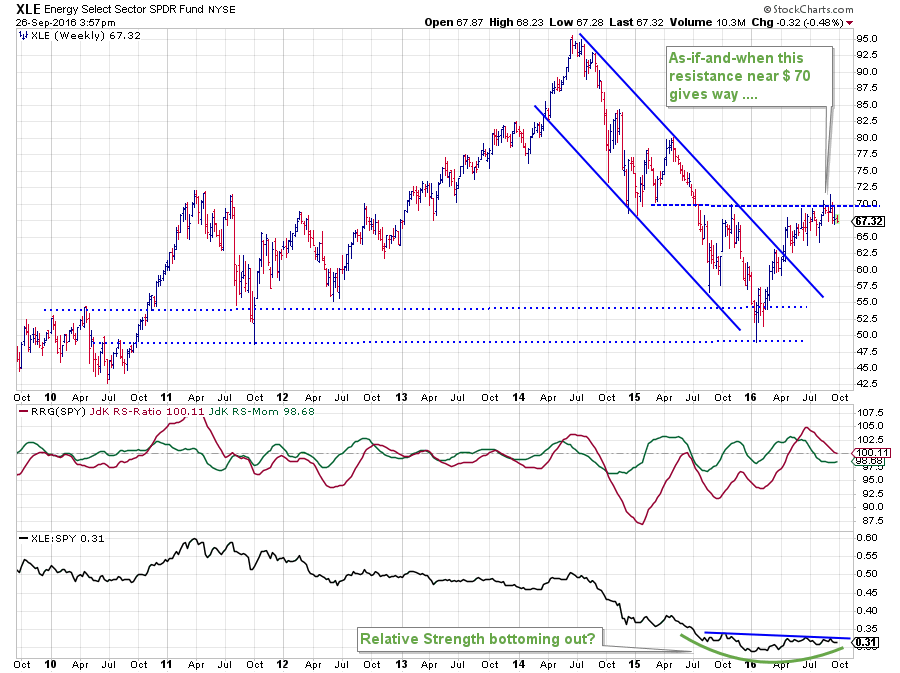
The Energy sector had a tough time from its high in 2014, around $ 95, to its low around $ 50 that was set at the beginning of this year.
Relative strength has kept up (or down is probably a better word) with the price direction for pretty much this whole period. This started to change during the transition from 2015 into 2016. The pace of the relative downtrend started to get less steep, causing RS-Momentum to push above 100 and rotate XLE into the leading quadrant a few weeks later.
XLE then had a strong rotation through the leading quadrant and eventually rotated back into the weakening quadrant again. At this moment XLE has approached the 100-level on the RS-Ratio axis very closely but now starts to pick up relative momentum again.
This makes it a very interesting situation or potential rotational pattern.
Relative strength has definitely improved since the beginning of the year, and the raw RS-Line seems to be working its way in a rounding bottom like fashion. But it needs a bit more improvement to really turn it around.
This improvement has to continue rapidly in coming weeks to prevent XLE from pushing over into the lagging quadrant. The fuel to do this has to come from positive price action.
On the price chart, XLE is running into resistance around $ 70 following a strong rally after breaking its down trending channel. I will keep an eye on XLE pushing beyond $ 70 to fuel that positive rotation back into the leading quadrant.
General market
Only two sectors solidly inside the leading quadrant and the important financial sector already starting to lose relative momentum, just when it is moving into leading, does not bode well for the broader market. It needs more and broader participation in order to move significantly higher.
Julius de Kempenaer | RRG Research
RRG, Relative Rotation Graphs, JdK RS-Ratio and JdK RS-Momentum are registered TradeMarks by RRG Research
Follow RRG Research on social media: