Top Advisors Corner April 29, 2016 at 11:49 AM
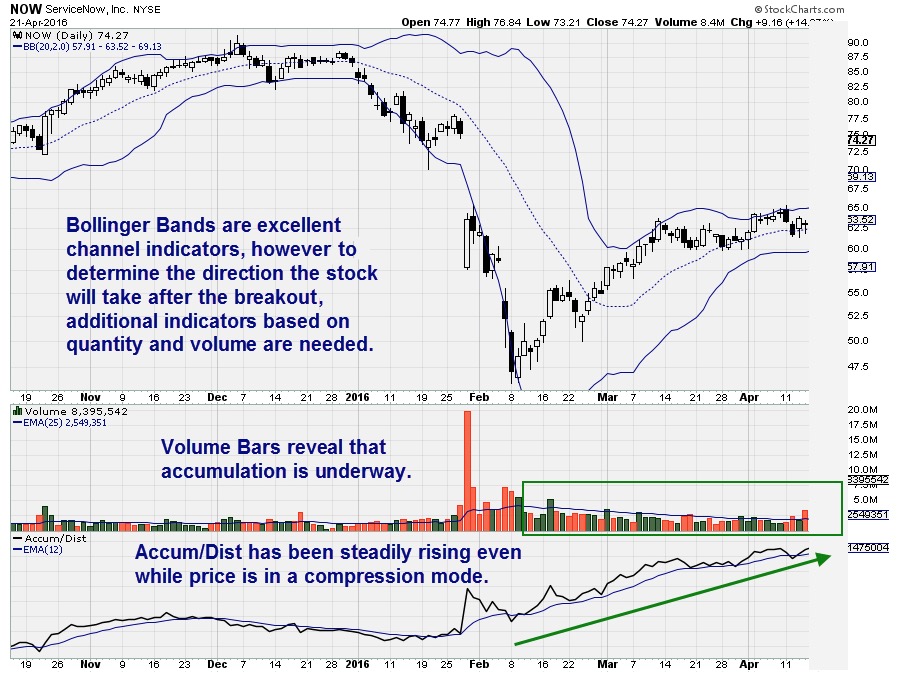
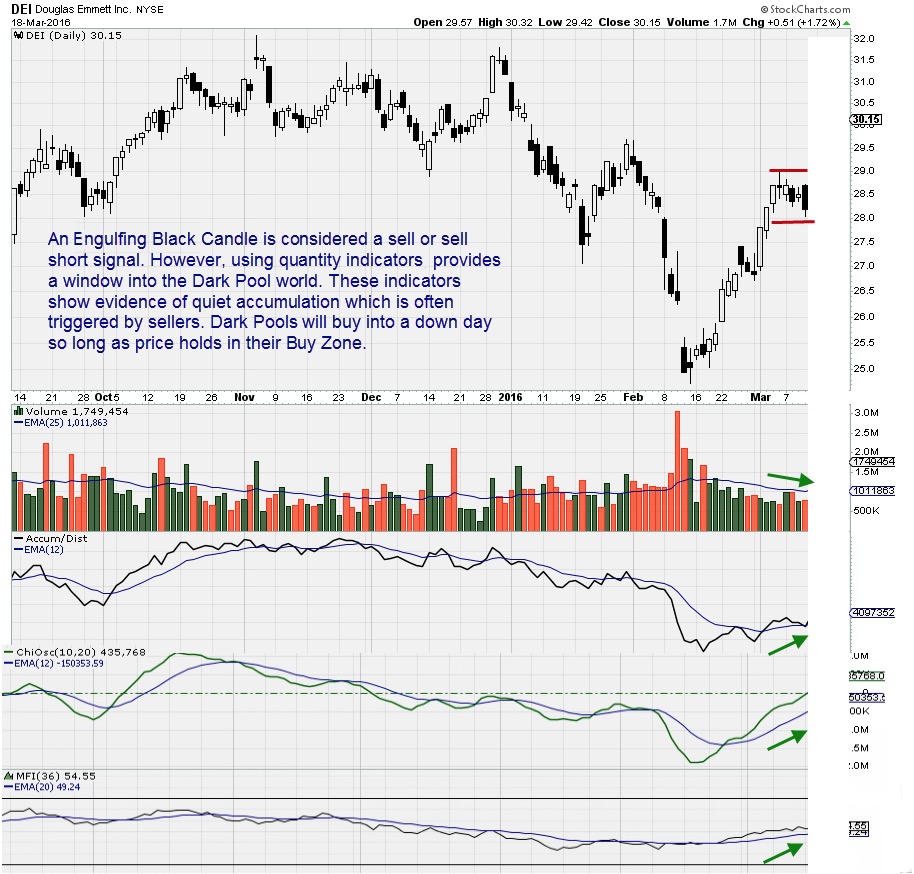
Adding Quantity, Volume, or Flow of Funds Indicators to the Analysis One of the most exasperating things that happen to Retail and Technical Traders is to find a chart with a perfect setup but the stock has already gapped or run up with a huge one day gain, as High Frequency Trad... Read More
Top Advisors Corner April 29, 2016 at 10:37 AM
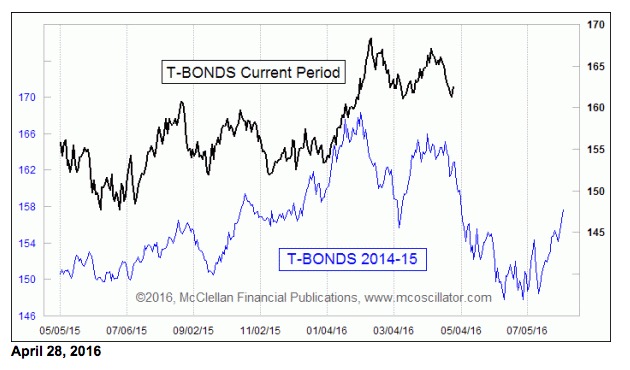
This time, the headline says it all. So many investors believe that it is the Fed that determines interest rates, and thus bond prices. Or alternatively, it is the mysterious force of inflation that drives interest rates... Read More
Top Advisors Corner April 27, 2016 at 10:43 AM
Monitoring purposes SPX: Neutral Monitoring purposes GOLD: Long GDX on 4/14/16 at 21.60 Long Term Trend monitor purposes: Short SPX on 1/13/16 at 1890.28 The FOMC meeting started today and runs into tomorrow and may have a short term affect on the market... Read More
Top Advisors Corner April 25, 2016 at 11:46 AM
The Nasdaq has been lagging for the entire year and that's simply because of the higher P/E's associated with those four letter stocks... Read More
Top Advisors Corner April 22, 2016 at 11:32 AM
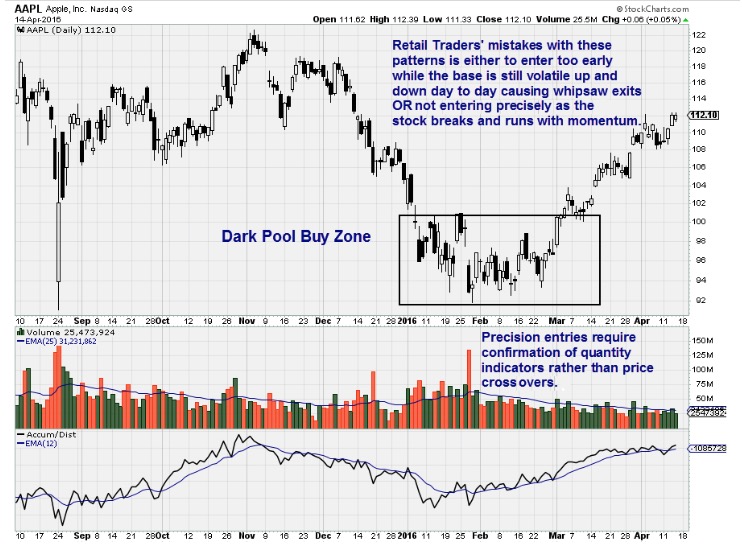
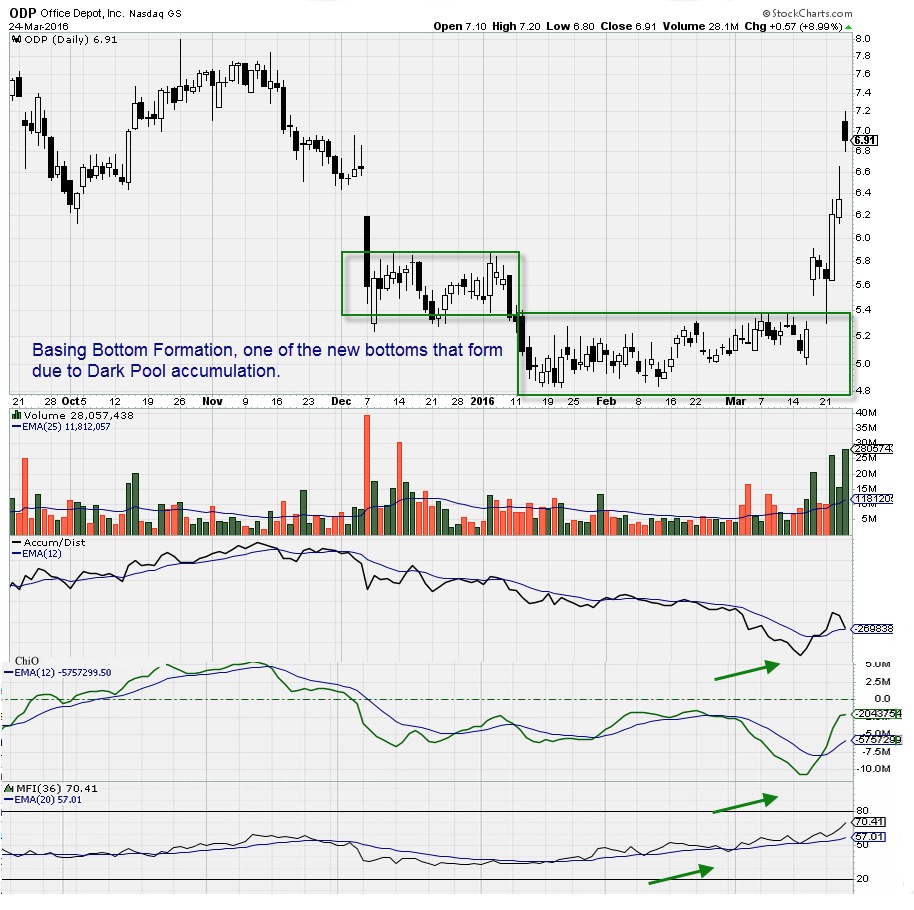
How to Calculate the True Cost of Trading TechniTrader in partnersip with StockCharts.com recently held a virtual training webinar on how to identify Dark Pool activity... Read More
Top Advisors Corner April 22, 2016 at 11:27 AM
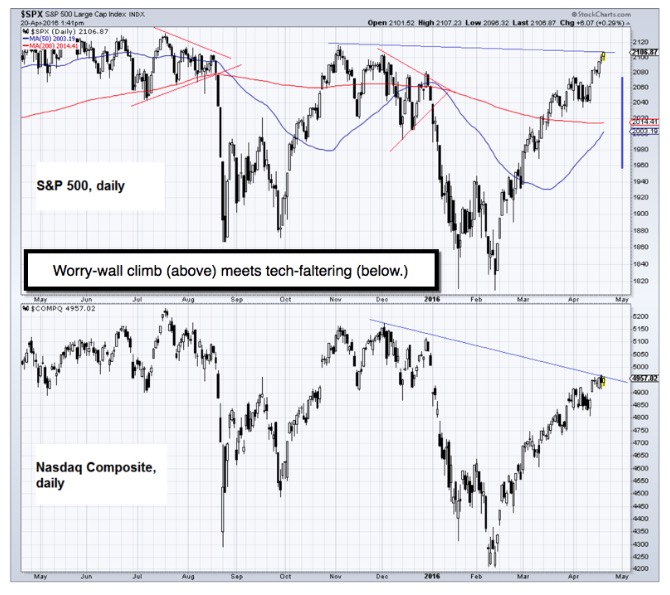
A tremendous divergence - exists aside the economic realities in the USA and the level of the S&P; that got so extended in a persistent performance quest by a slew of bankers and money managers fretting that they can't make money this year... Read More
Top Advisors Corner April 22, 2016 at 11:17 AM
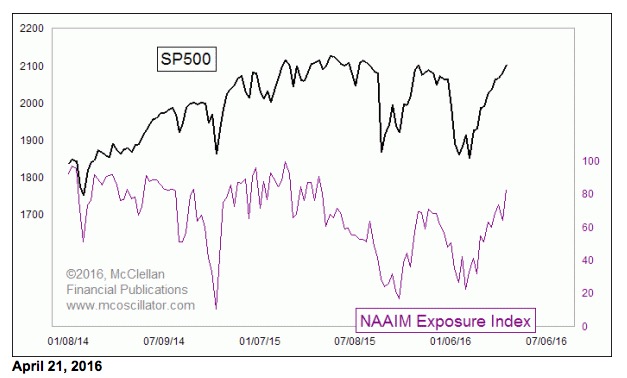
The rally off of the February 11 low for the SP500 has been called “the most hated rally” by some in the financial media. But it does not appear to be hated according to a lot of the sentiment indicators... Read More
Top Advisors Corner April 21, 2016 at 10:40 AM
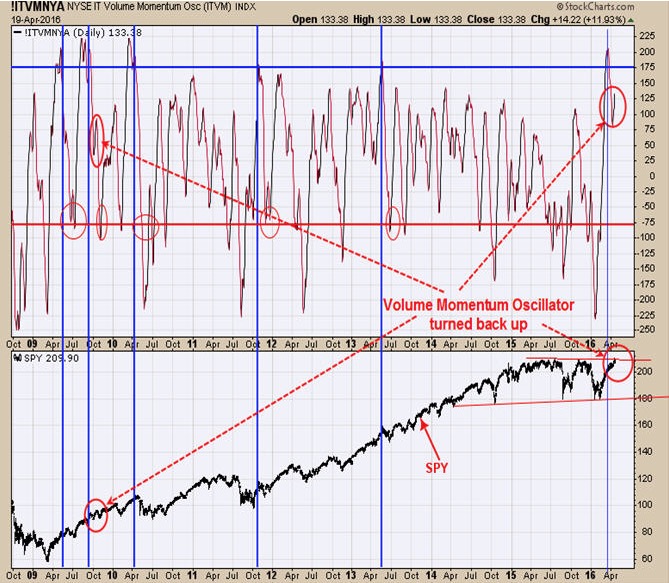
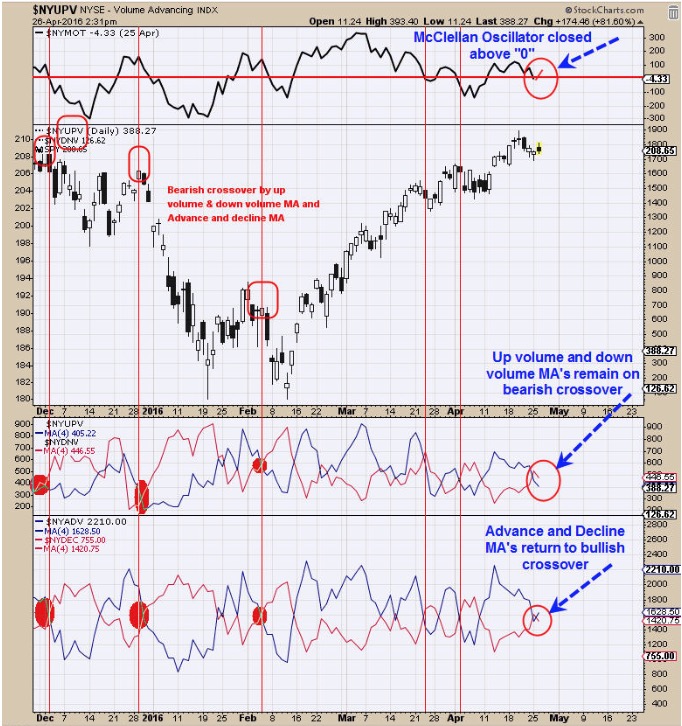
Monitoring purposes SPX: Neutral Monitoring purposes GOLD: Long GDX on 4/14/16 at 21.60 Long Term Trend monitor purposes: Short SPX on 1/13/16 at 1890.28 We showed this chart before which is the Volume Momentum Oscillator... Read More
Top Advisors Corner April 18, 2016 at 09:42 AM
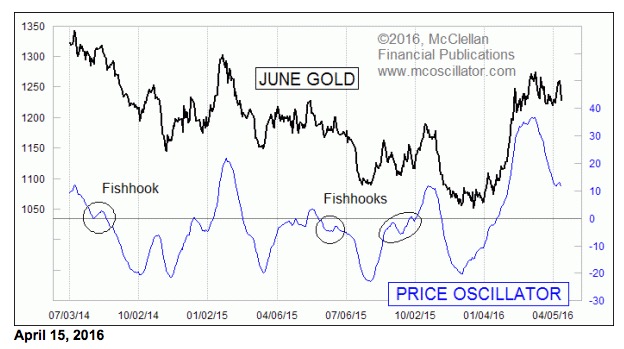
Gold revealed an interesting bit of information this week when it formed what we call a “fishhook” structure. Fishhooks are important because they can reveal the potential for a more powerful move... Read More
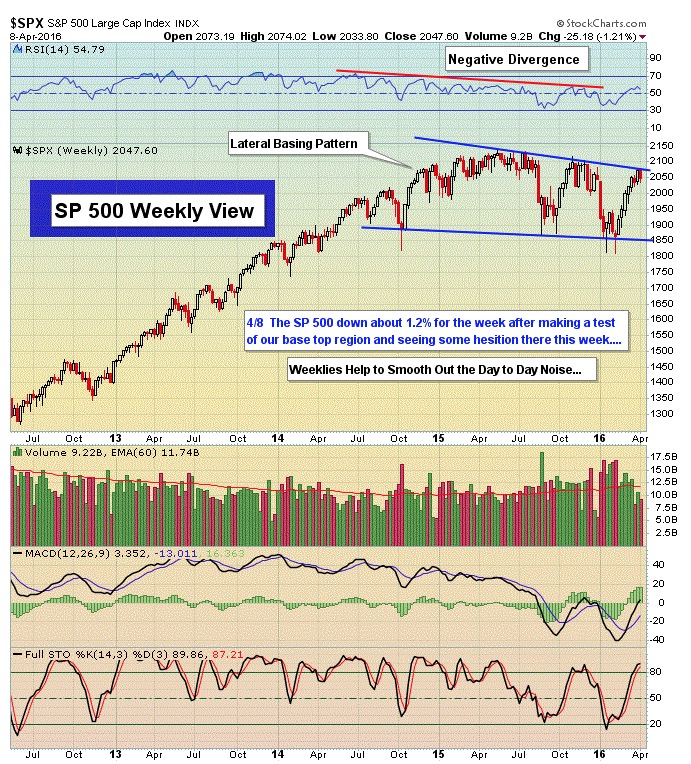
Top Advisors Corner April 15, 2016 at 01:48 PM
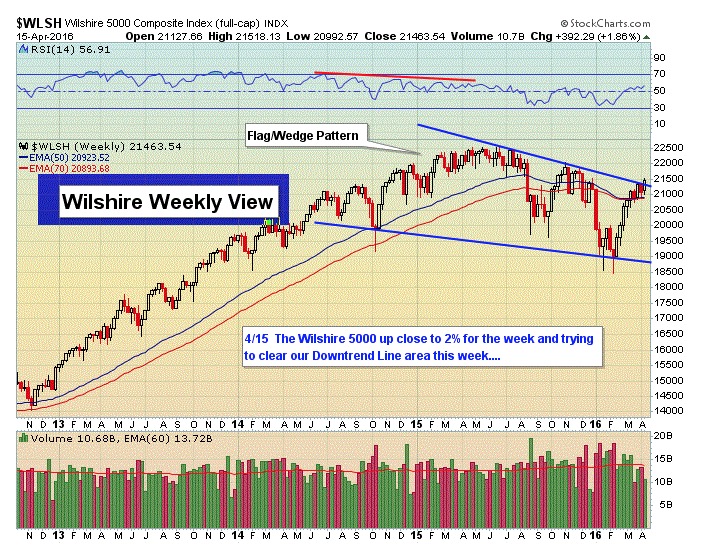
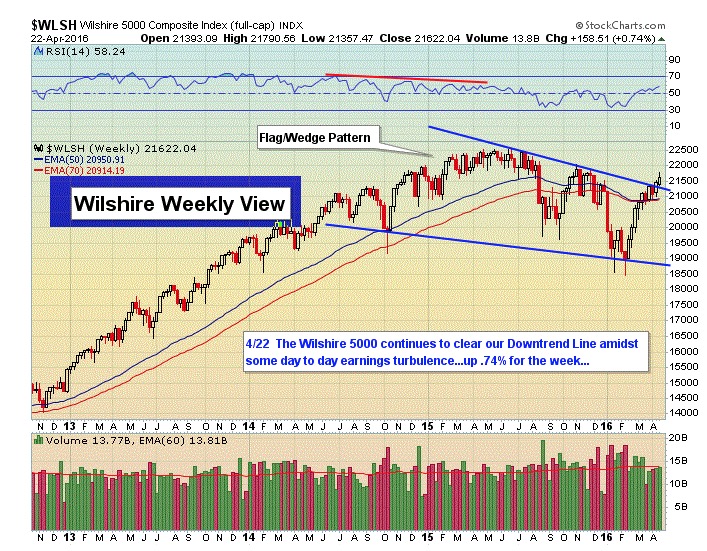
When a market breaks out over critical down trend line resistance you'd like to see that breakout occur in a forceful way that's convincing. A breakout that allows the bulls to feel confident going forward... Read More
Top Advisors Corner April 14, 2016 at 12:33 PM
Why the Market Moves Sideways Trading so-called “Volatile Markets” can seem like a daunting task. Many Retail Traders struggle during these phases of trading action, and do not recognize how to cope with “Volatile” Trading Conditions... Read More
Top Advisors Corner April 14, 2016 at 09:56 AM
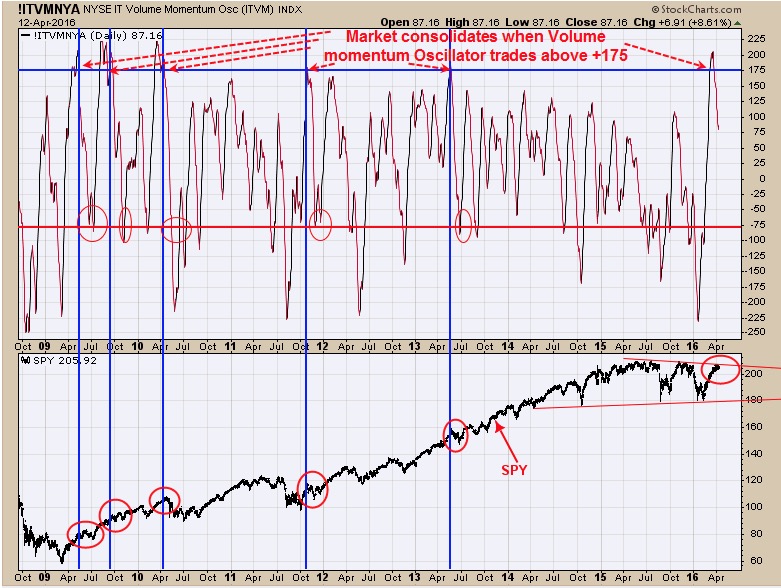
Monitoring purposes SPX: neutral. Monitoring purposes GOLD: Neutral Long Term Trend monitor purposes: Short SPX on 1/13/16 at 1890.28 Above chart is the Volume Momentum Oscillator for the NYSE. This chart goes back in mid 2008... Read More
Top Advisors Corner April 08, 2016 at 02:04 PM
So the market gapped up again as usual this morning due to the fed speak from last night. Any time the fed opens her mouth the market can't wait to rise. Flat futures became rocking futures even though the action from yesterday was quite bearish in nature for the very short term... Read More
Top Advisors Corner April 08, 2016 at 09:07 AM
More Opportunities for Lower Capital Based Traders One thing that is a constant in the Financial Markets and especially in the Stock Market over the past few years, is change. Everything about Technical Analysis is changing... Read More
Top Advisors Corner April 06, 2016 at 10:40 AM
Monitoring purposes SPX: neutral. Monitoring purposes GOLD: Short GDX on 2/24/16 at 19.11. Long Term Trend monitor purposes: Short SPX on 1/13/16 at 1890.28 This is the week before option expiration week and a week where whipsaws are common... Read More
Top Advisors Corner April 04, 2016 at 12:16 PM
Excerpts from the March 28th issue Rationales & Targets We expected another flash crash in March but it hasn’t happened....yet. Of course, with just a few days to go, the odds now appear remote and we can accept that... Read More
Top Advisors Corner April 04, 2016 at 10:49 AM
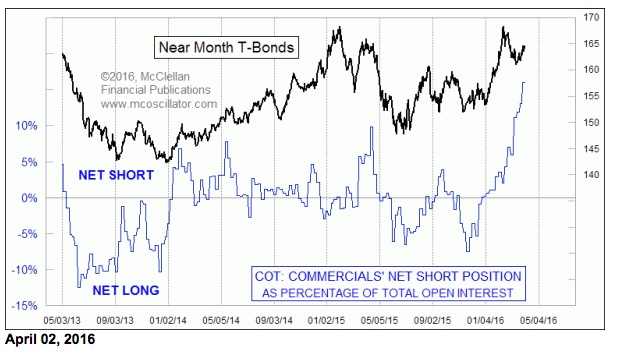
Commercial traders of T-Bond futures have been increasing their net short position in a big way in recent weeks, and Friday’s COT Report showed a renewed upward acceleration. Normally I find that prices and the commercials’ net position are positively correlated... Read More
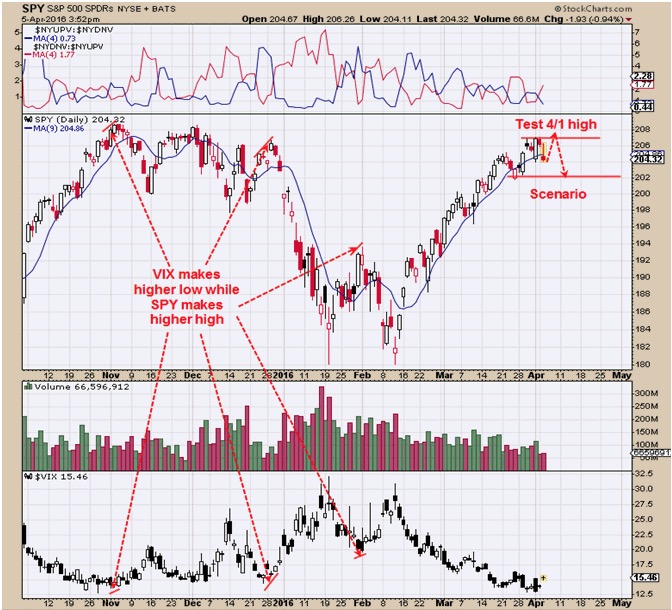
Top Advisors Corner April 01, 2016 at 06:15 PM
The market day started with some nasty futures as the overbought daily index charts were finally about to unwind some and that would have been great news. An hour before the market opened we got the much anticipated jobs report... Read More
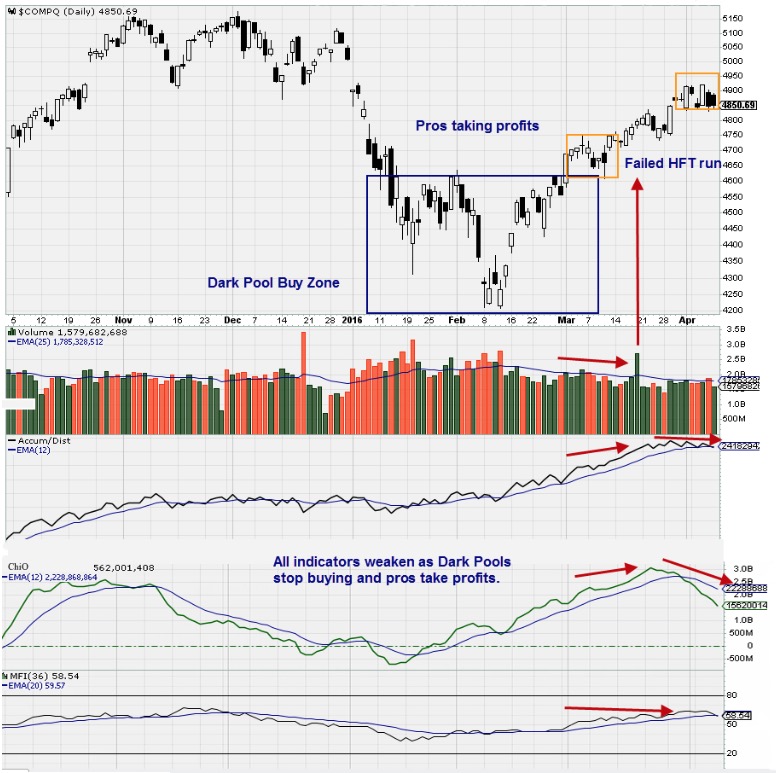
Top Advisors Corner April 01, 2016 at 03:01 PM
Momentum Runs are not perpetual. At some point Professional Technical Traders who are one of several drivers behind Momentum Runs, will take profits at technical resistance levels... Read More
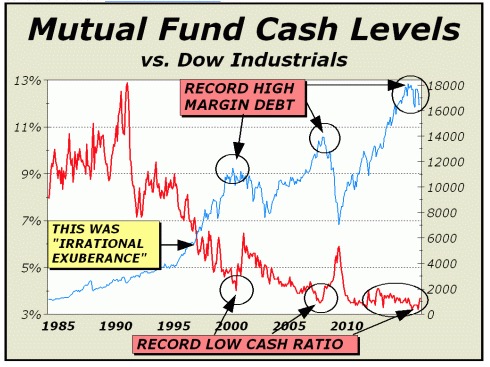
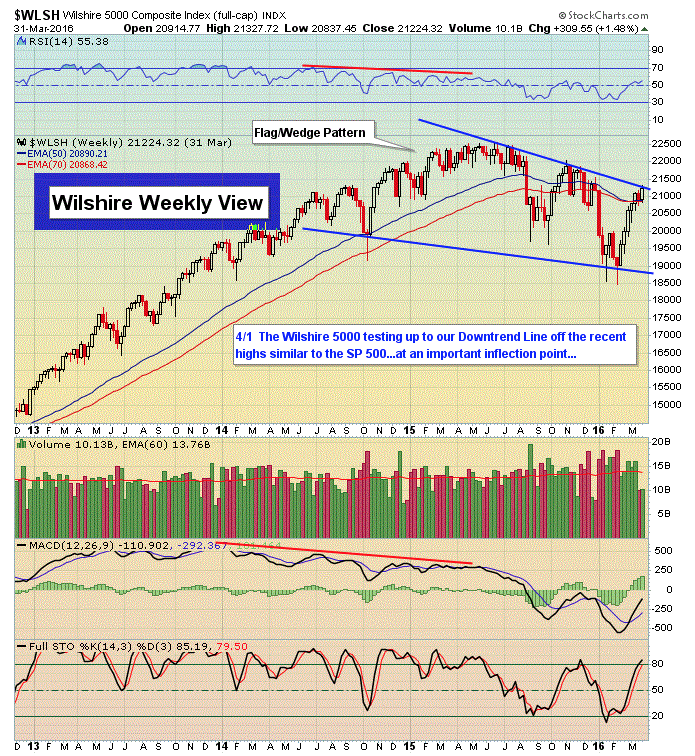
Top Advisors Corner April 01, 2016 at 10:41 AM
From a macro perspective - we're experiencing an S&P topping formation that may or may not turn 'south' rapidly; or persist in a distribution process. That after all, characterized the past year-and-a-half, and is again dangerously extended... Read More