In a week marked with volatility, one stock has been in a clear uptrend. After news of the release of its iPhone 7 on Friday, Apple’s stock (AAPL) has been up over 10%. While the initial release news wasn’t overly exciting, it’s the subsequent announcements that the Plus model as well as the smaller model’s black colored version have sold out.
Analysts point to several reasons for the sell-out ranging from a limited release to select countries to the recent announcements of fire issues with Samsung’s competing model. The real reason may be more basic however as many iPhone users are at the end of their 2 year leases and are looking to upgrade. Whatever the cause, it’s been good news for the company’s stock as investors continue to scoop up shares.
After such a run-up, investors who own Apple stock may be wondering if they should sell while those who missed the 10% move may wonder if it’s too late to buy. Let’s use the charts below to provide guidance.
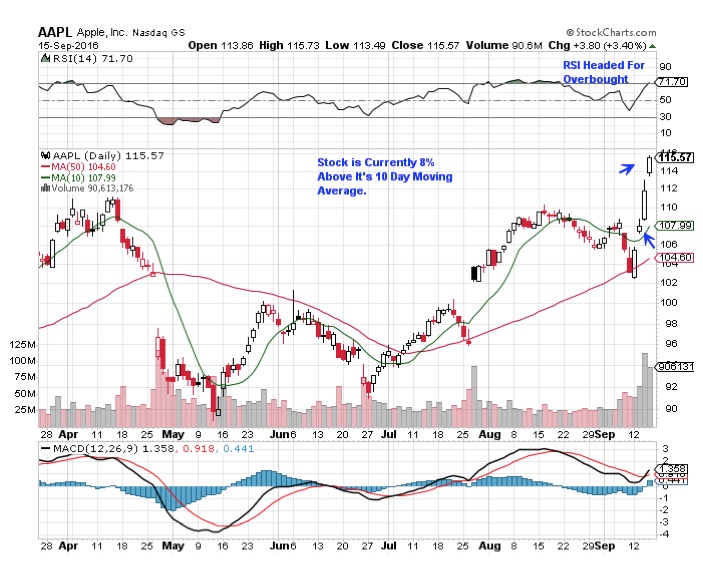
The Daily chart shows recent strength with 3 days of gap-ups that have all occurred on well-above average volume. While quite positive, when looking at the current price relative to its 10 day moving average, the stock is clearly extended. You’d have to go back to mid-March 2012 to see Apple stock this far above its 10 day mav. As some of you may recall, 2012 was an explosive period for the company as they continued to release new versions of their popular iPad and iPhones.
All in all, the stock is stretched to a level that previously was supported by being in its third year of high growth. This recent move is more a reaction to the surprise sellout of its latest iPhone. At this point, the stock is due either a pullback to its 10 day moving average or a pause while the moving average moves up to meet the current price.
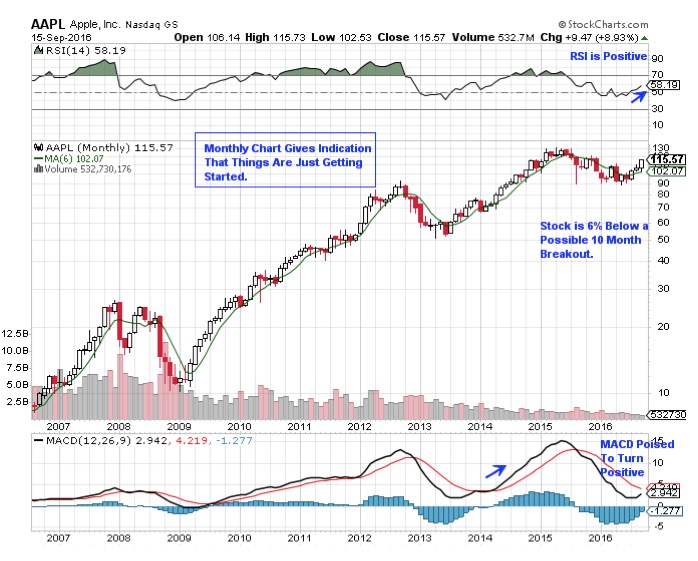
That said, the longer term chart of Apple looks quite interesting. This recent move has pushed the longer term RSI into positive territory with the MACD poised to follow. The last time the longer term MACD did this was in the beginning of 2014 and the subsequent move was 81%. Another potential bright spot on the monthly chart is the possibility of the stock breaking out of a 10 month base. As always, the longer your base, the higher the possible upside after breaking out of that base.
Below are the highlighted charts for both the Daily and the Monthly after the market close September 15th.
Mary Ellen McGonagle
Editor - The MEM Edge
www.MEMInvestmentResearch.com