
Monitoring purposes SPX: Short SPX on 10/5/16 at 2159.73.
Monitoring purposes GOLD: Covered Short GDX on 10/6/16 at 22.88= gain 17.5%; Short GDX on 9/22/16 at 27.75.
Long Term Trend monitor purposes: Short SPX on 1/13/16 at 1890.28
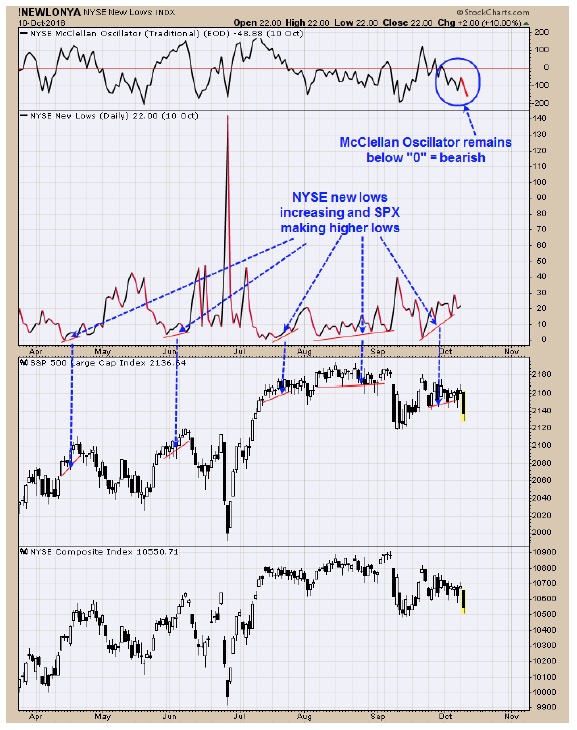
Above are examples where the SPX was making higher lows as the NYSE New lows was increasing showing the market was on thin ice. Today’s down push confirmed the bearish setup on the NYSE New lows indicator. The top window is the NYSE McClellan Oscillator which hit a new short term low suggesting the decline in the SPX should continue. We are short SPX on 10/5/16 at 2159.73.”
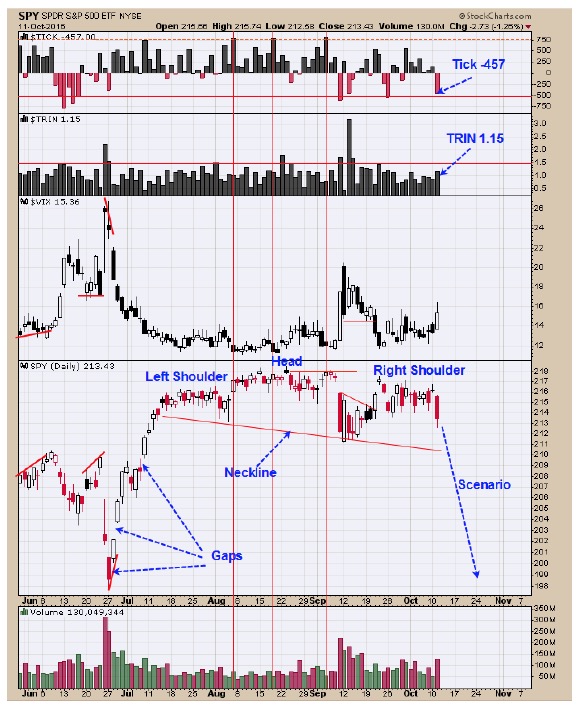 Yesterday we said, “A possible scenario that may be in development is a Head and Shoulders top. The Right
Shoulder is forming now. To help qualify this pattern, we would like to see volume increase on the coming potential pull back and not see panic in the tick or trin as the pull back progress. A break of the “Neckline” near 210 on the SPY would need to come on a “Sign of Weakness”. There are gaps below from 198; 202 and 209 and all are possible downside targets.” We are watching closely how the TRIN and Ticks are responding on this pull back. If the TRIN and Ticks beginning to show panic (which will indicate a bottom is nearing) we will cover our short SPX position. Today the TRIN closed at 1.15 (very minor panic) and the TICK closed at -457 which is in panic levels. However, both the TRIN and TICK need to show panic at the same time and that did not happen today. There still could be a bottom here but the TRIN and Tick readings so far are not showing panic together.
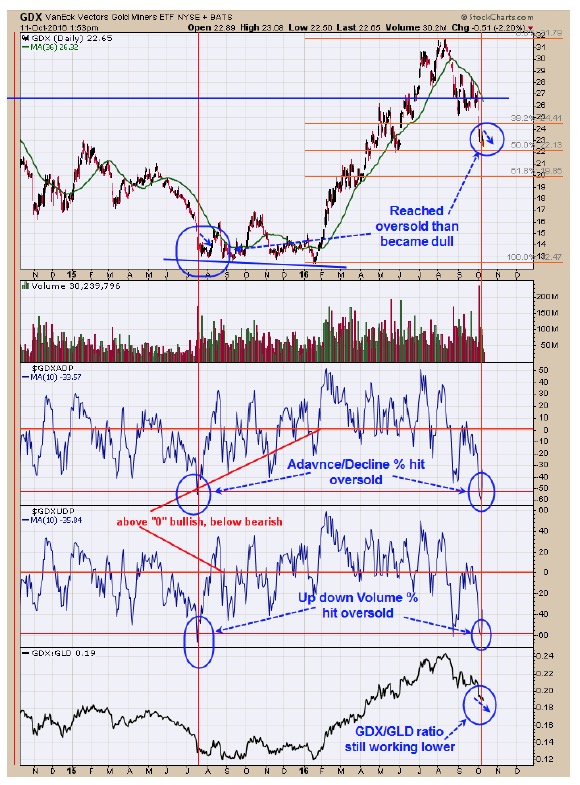
We have a cycle low due in October and we are looking for a bullish setup in this timeframe. The second window up from bottom is Up down volume Percent with 10 period moving average. When this ratio reaches below 60, an oversold condition is present. Next window up is the Advance/Decline Percent and readings below 50 indicate an oversold condition and both of these indicators reached oversold conditions. The last time these two indicators reached this type of oversold condition was back in mid July 2015 and market wiggled down slightly over the next couple of weeks. The bottom window is the GDX/GLD ratio which is still trending down and a short term bearish sign. In a nutshell market is building a low near current levels and has not turned up yet. Covered short GDX on 10/6/16 at 22.88 for gain of 17.5%. Short GDX on 9/22/16 at 27.75.
Tim Ord,
Editor
For examples in how "Ord-Volume" works, visit www.ord-oracle.com. New Book release "The Secret Science of Price and Volume" by Timothy Ord, buy on www.Amazon.com.