
SPX Monitoring purposes; Covered 12/30/16 at 2238.83= gain .46%; Short on 12/29/16 at 2249.26.
Monitoring purposes GOLD: Long GDX on 12/28/16 at 20.25.
Long Term Trend monitor purposes: Short SPX on 1/13/16 at 1890.28
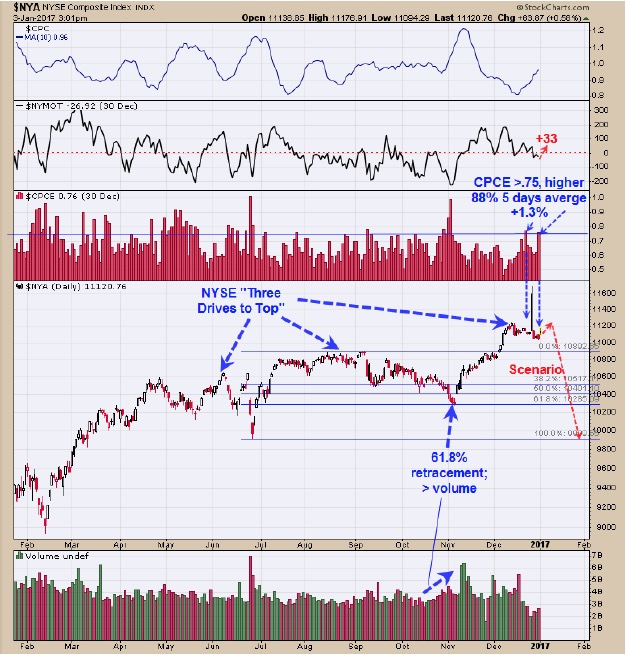
The NYSE composite daily chart above. The potential “Three Drives to Top” may be forming on the NYA. The retracement off of the second top was 61.8% and came on increased volume giving credit to this pattern. The McClellan Oscillator is back above “0” (close near +47) and back in bullish territory. The Equity Put/Call ratio closed Friday at .76. Reading above .75 predicts a rally averaging 1.3%, 88% of the time in the next five days. Today’s bounce was .85% leaving another .5% to go if the average is obtained. Today’s closing tick reached +883 and show short term exhaustion suggesting upside is limited. Though there are intermediate term bearish signs, there are bullish short term signs that predict a bounce first. If the “Three Drives to Top” pattern proves to be correct a pull back to near 10,000 on the NSYE is possible which would equate to 2000 on the SPX. Covered 12/30/16 at 2238.83 = gain .46%; Short on 12/29/16 at 2249.26. Ask for free 30 day trial.
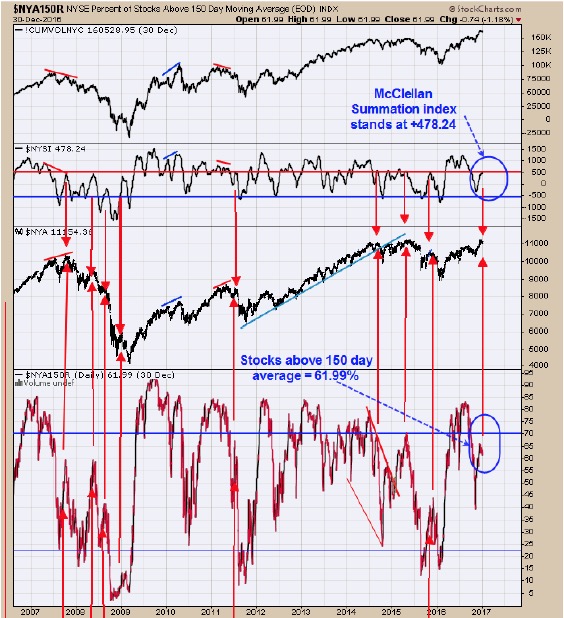 When the NYSE McClellan Summation index turns down before reaching +500 and NYSE stocks above 150 day average turns down before reaching +70%, sharp decline can materialize. Friday, the McClellan Summation index closed at 478.24, below +500 and intermediate term bearish. Friday, the Stocks above 150 day average stood at 61.99 and below the 70% and also intermediate term bearish. The potential for a sharp decline in the market is present. Follow us on twitter https://twitter.com/ordoracle;
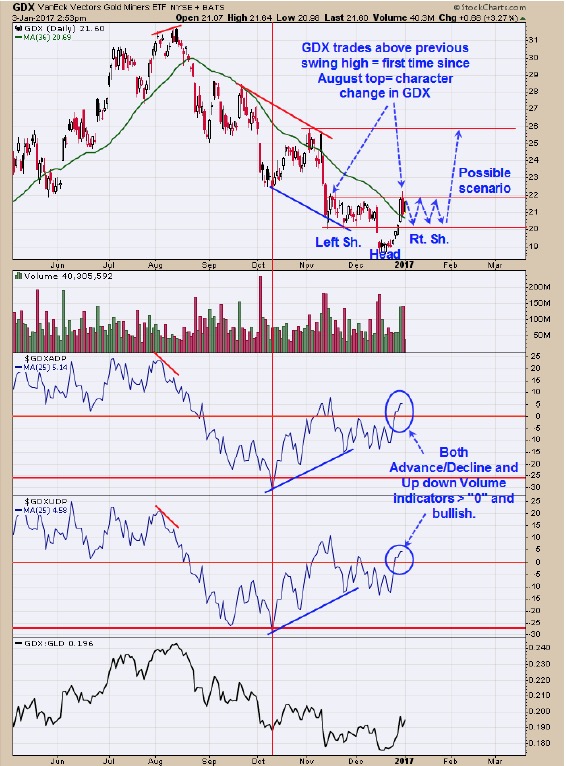 The pattern forming on GDX could be a Head and Shoulders bottom where the December low is the Head. The rally off of the December low was quite strong and exceeded the previous swing high of November. This impulse wave up from the December low will need a rest and build a trading range to build up strength for the next move up. The next trading range could be the “Right Shoulder” of a Head and Shoulders bottom. This potential “Head and Shoulders bottom” has an upside target near the next swing high of 26.00 range. Both Advance/Decline % and Up down Volume % remain above “0” and bullish. Long GDX on 12/28/16 at 20.25. For examples in how "Ord-Volume" works, visit www.ord-oracle.com. New Book release "The Secret Science of Price and Volume" by Timothy Ord, buy on www.Amazon.com.
Tim Ord,
Editor