Market Recap for Thursday, January 20, 2017
The industrial sector (XLI, +0.73%) was the only sector to finish in positive territory as railroads ($DJUSRR) broke out on massive volume Thursday. CSX Corp (CSX) soared more than 23% after Canadian Pacific's (CP) CEO Hunter Harrison announced he was quitting at CP and had interest in being hired at CSX. A Morgan Stanley analyst quickly upgraded CSX and the railroads took off.
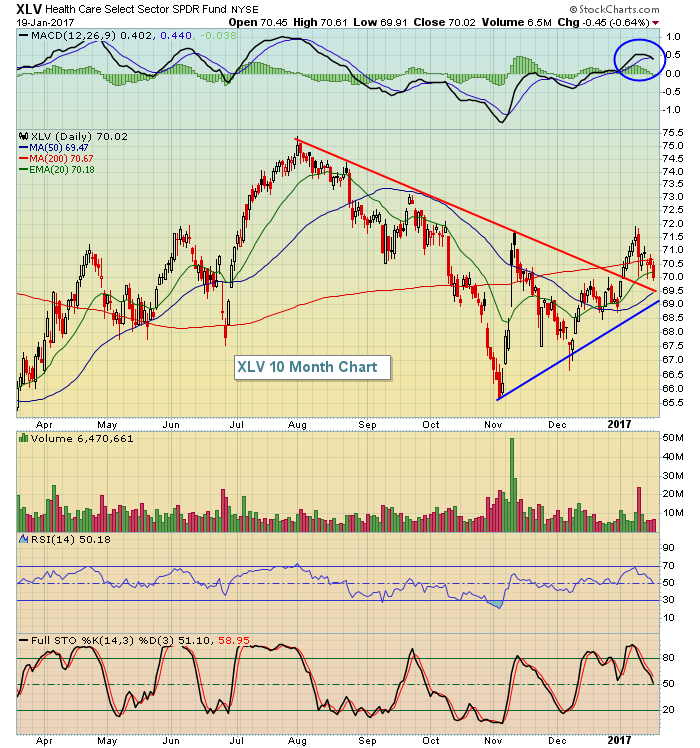
The eight remaining sectors lost ground during a session of profit taking. In particular, healthcare's (XLV, -0.64%) drop left that sector approaching a significant uptrend support line. Check this out:
 A key support area would seem to be the 69.00-69.50 range as that represents the recent uptrend line and a back test of the longer-term downtrend line breakout in early January.
Pre-Market Action
In Asia overnight, the Hang Seng Index ($HSI) fell 164 points to 22886. The HSI has much stronger technicals now and the rising 20 day EMA should provide solid support. Currently, that level is at 22590. In Europe, markets are relatively calm and stable with most key indices trading near the flat line.
The 10 year treasury yield ($TNX) is continuing its bounce after recently resetting its daily MACD at the zero line and absorbing a 50 day SMA test - both occurring after a negative divergence printed on its daily yield high at 2.60% in mid-December. This morning, the TNX is up another 3 basis points to 2.49%. The current range on the TNX has now been established from 2.30% to 2.60%. A breakout above 2.60% would likely accompany another surge higher in the U.S. Dollar Index and would be a boon to banks ($DJUSBK) and life insurance companies ($DJUSIL).
Dow Jones futures are higher by 21 points on Inauguration Day, the day that the newly elected U.S. President takes the oath from the Chief Justice. President Trump's four year term begins today at noon eastern time.
Current Outlook
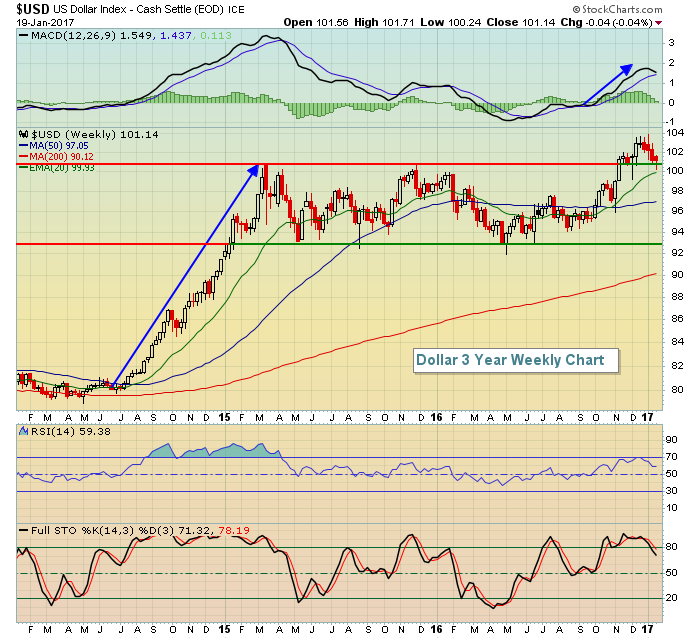
The U.S. Dollar Index ($USD) recently broke out of a very bullish long-term pattern and we've seen profit taking in the greenback back to both price support and its rising 20 week EMA. Weekly momentum remains very strong and typically rising 20 week EMA provides excellent support during such periods. Check out the current technical outlook for the USD:
 The breakout in early November was significant technically as it followed a lengthy continuation pattern. The prior advance was a flag pole with the subsequent multi-year consolidation the flag. After a breakout of such a pattern, I look for either price support near 101 or the rising 20 week EMA, currently just below 100, as key support levels. Thus far, both have held. I'm looking for additional strength ahead for the dollar with no need to re-evaluate unless we see a weekly close beneath both of the support levels identified above.
Sector/Industry Watch
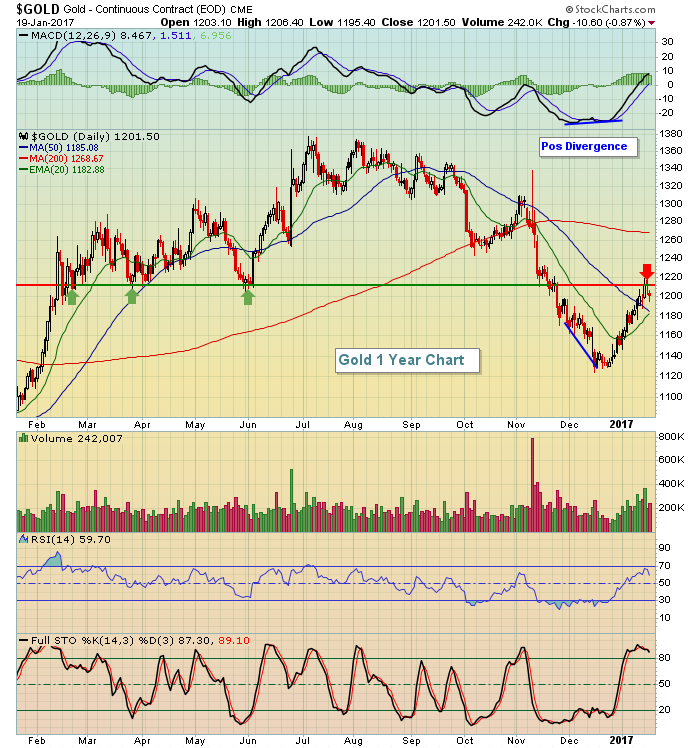
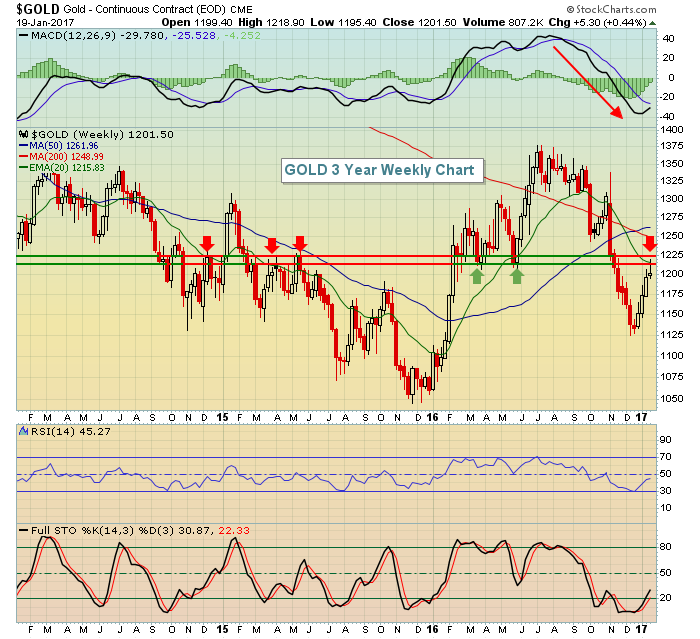
Given the technical conditions on the U.S. Dollar provided above, I'd be very, very careful with gold ($GOLD). After a huge decline in gold, a positive divergence emerged and that suggested we'd see short-term strength in gold and profit taking in the dollar was a major catalyst to make it happen. But I believe gold has run its course short-term and the longer-term weekly downtrend is on the verge of resuming. Below is the daily chart on $GOLD, followed by the weekly chart:
 The positive divergence on the MACD suggested we'd see a MACD reset near the centerline, along with a possible 50 day SMA test. We've seen both of those so the daily MACD has done its work. Now let's look at the weekly outlook:
 Weekly momentum gives us a totally different picture with the MACD here pointing straight down on the most recent price low. That tells me that any rise to test the declining 20 week EMA will likely be a failure. The red arrows above mark key price resistance on several occasions in the 1215-1225 zone. That happens to coincide with the declining 20 week EMA, currently at 1215.83. Should gold break above 1225 and the dollar fall beneath 100, I'd re-evaluate both. Until that occurs, I'd follow the likely direction of gold, which in my opinion is lower.
Historical Tendencies
Since 1987, the Russell 2000 has produced annualized returns of -134.18% on January 20th. Today is January 20th. However, I wouldn't place too much emphasis on this because sample results are only as good as their sample size. In this case, we're talking about the performance of 19 trading days, certainly not a representative sample. But I thought it was at least interesting enough to point out.
Key Earnings Report
(actual vs. estimate):
COL: 1.20 vs 1.14
GE: .46 vs .46
PG: 1.08 vs 1.07
RF: .23 vs .22
SLB: .27 vs .27
STI: .90 vs .88
SYF: .70 vs .67
Key Economic Report
None
Happy trading!
Tom
