Market Recap for Wednesday, January 12, 2017
The U.S. Dollar Index ($USD) fell for the fourth time in the past six trading sessions after sideways consolidating for a couple weeks prior. This hesitation and recent profit taking has provided fuel for a rebound in gold ($GOLD) and silver ($SILVER) prices. I believe this sudden turn will be short-term in nature and that the longer-term trends in play will prevail. For now, however, you can see the inverse correlation from the chart below:
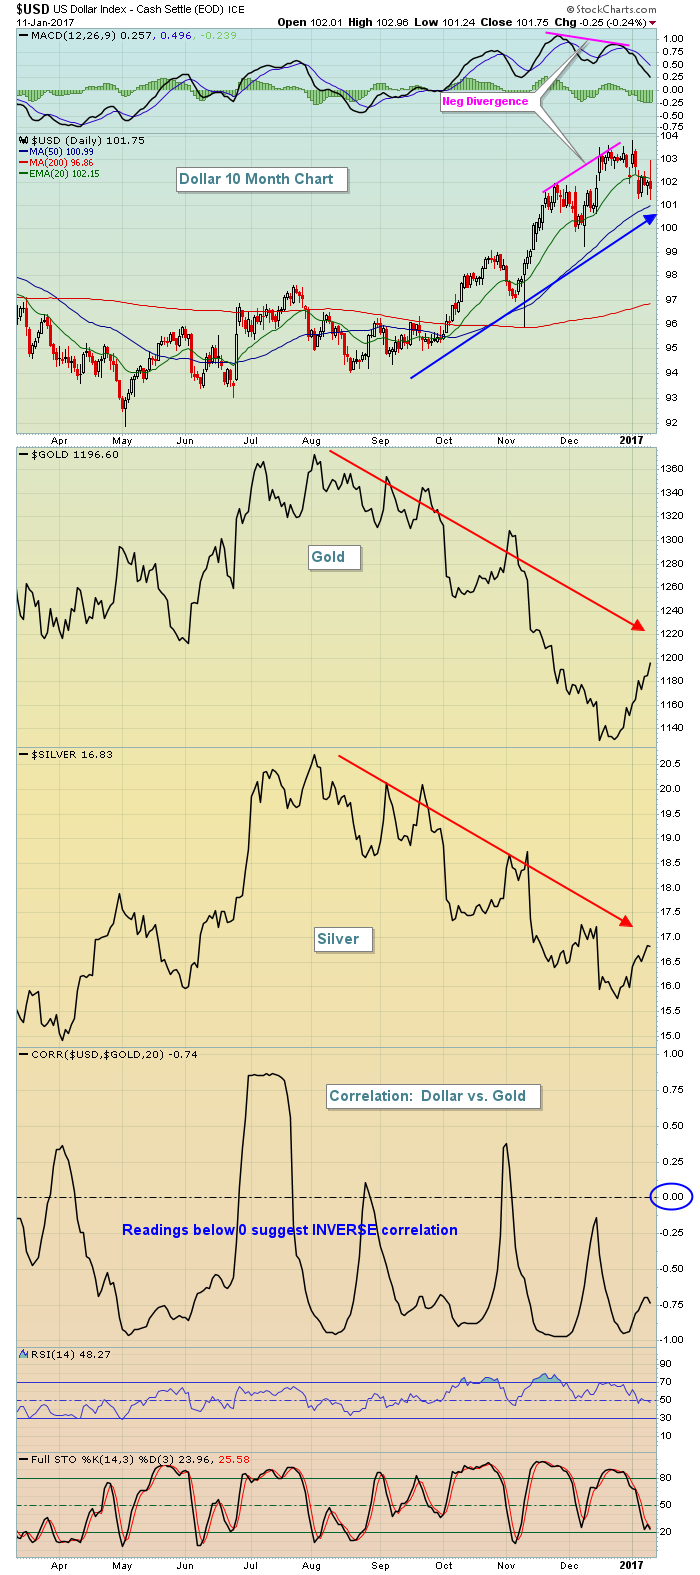 The USD printed a negative divergence at its most recent high in December, suggesting that momentum was slowing in the near-term. It also was short-term overbought at the time with an RSI reading at 70. So the stage was set for an unwinding of the dollar which, in turn, left gold and silver shorts vulnerable to oversold buying. Now the question becomes - is the recent buying in gold the start of a significant uptrend or is this rally nearing its end. I believe it's the latter based on the longer-term downtrend in gold that's now in play. Here's that longer-term look:
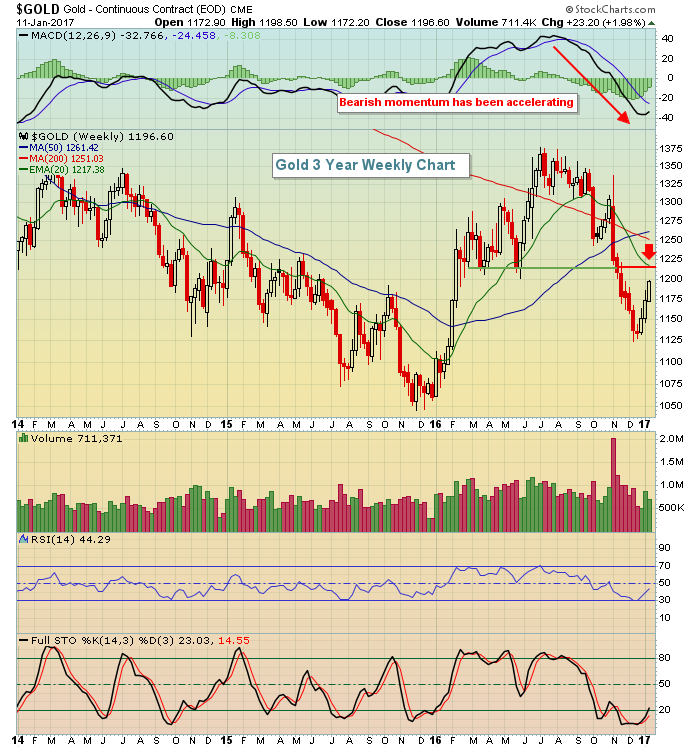 Clearly, the longer-term momentum is a major issue for gold bulls. Any test of the declining 20 week EMA is a major test in my view given the slope of that weekly MACD. So that provides a short-term upside opportunity to 1217, which also happens to be a price resistance level. In other words, the reward to risk is becoming rather unfavorable to initiate long positions here. A weekly close above 1220 would require a re-evaluation, but until then I'd actually favor shorting into this strength.
Energy (XLE, +1.08%) and materials (XLB, +0.81%) were among the leaders on Wednesday, benefiting from the profit taking occurring in the USD.
Pre-Market Action
Initial jobless claims came in better than expected this morning and several Fed officials will be speaking today. The 10 year treasury yield ($TNX) is down another 3 basis points to 2.34% and is now testing its 50 day SMA after printing a negative divergence in mid-December. That helped to mark the top in equity prices and the dollar so any bounce off its 50 day SMA will likely be a positive for both equities and the dollar - and bad for gold and silver.
There was selling overnight in Asia and that weakness has carried over to Europe this morning. That's prompted a bit of bearishness here in the U.S. this morning as well, with Dow futures currently down 36 points.
Current Outlook
The Dow Jones Industrial Average ($INDU) has been frustrated over the past week, trading in a very narrow 19810-19965 range for much of the last week and 2017. There will be plenty of FedSpeak today and a number of critical banks reporting their latest results tomorrow morning before the bell. Also, we'll see PPI, retail sales and consumer sentiment out Friday morning. My guess is that all of this data will spur the Dow Jones to either break out or perhaps fall back into a wider trading range to include its late December low near 19700. Here's a look at a very short-term 5 day 10 minute chart of the Dow:
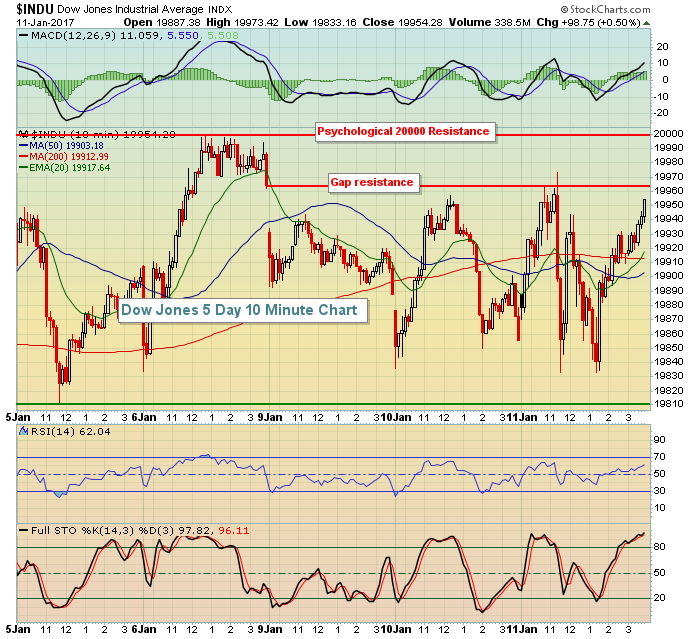 This is the poster child for what trendless means. Check out the price movement above and below moving averages as if they're not even there. Also, take a look at the MACD which repeatedly has moved above and below the centerline. This tells us that there is no momentum in either direction. That is likely to change with the all the news coming out tomorrow, assuming we don't break out of this trading range today. While the very near-term price and gap resistance is near 19965, the truly big number remains 20000.
Sector/Industry Watch
The Dow Jones U.S. Waste & Disposal Services Index ($DJUSPC) appears to be forming a very bullish handle after a cup formed in December. The daily chart, not shown below, shows consolidation after a negative divergence formed there. Based on that negative divergence, I'd look for a 50 day SMA test and that 50 day SMA is currently at 215. On the weekly chart below, the rising 20 week EMA should provide excellent support and that 20 week EMA is at 212. Therefore, consider that 212-215 area as a solid reward to risk entry into the space. Here's the weekly look:
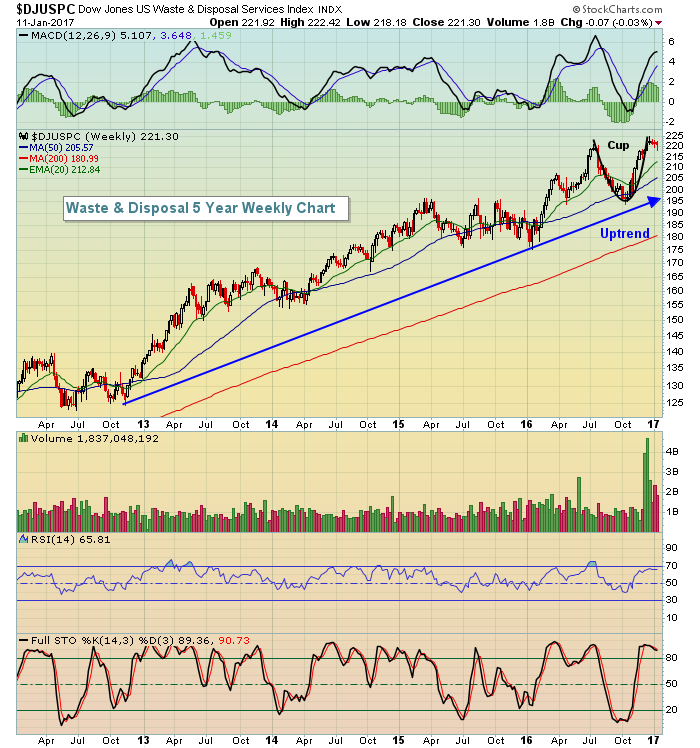 Continuation patterns require prior trends and it's rather obvious here that the DJUSPC has been in a long-term uptrend. Another point I'd like to make here. On every bottom in the trend, check out the weekly RSI. Every significant bottom formed with a weekly RSI at or near 40. Just sayin.....
Historical Tendencies
Historically speaking, January is not the month for Waste & Disposal stocks. So perhaps we see that handle form that I was discussing above. Seasonality favors this group from March to May, however, so if we see the breakout in February, historical tailwinds will help the group maintain its longer-term uptrend. Here are the numbers:
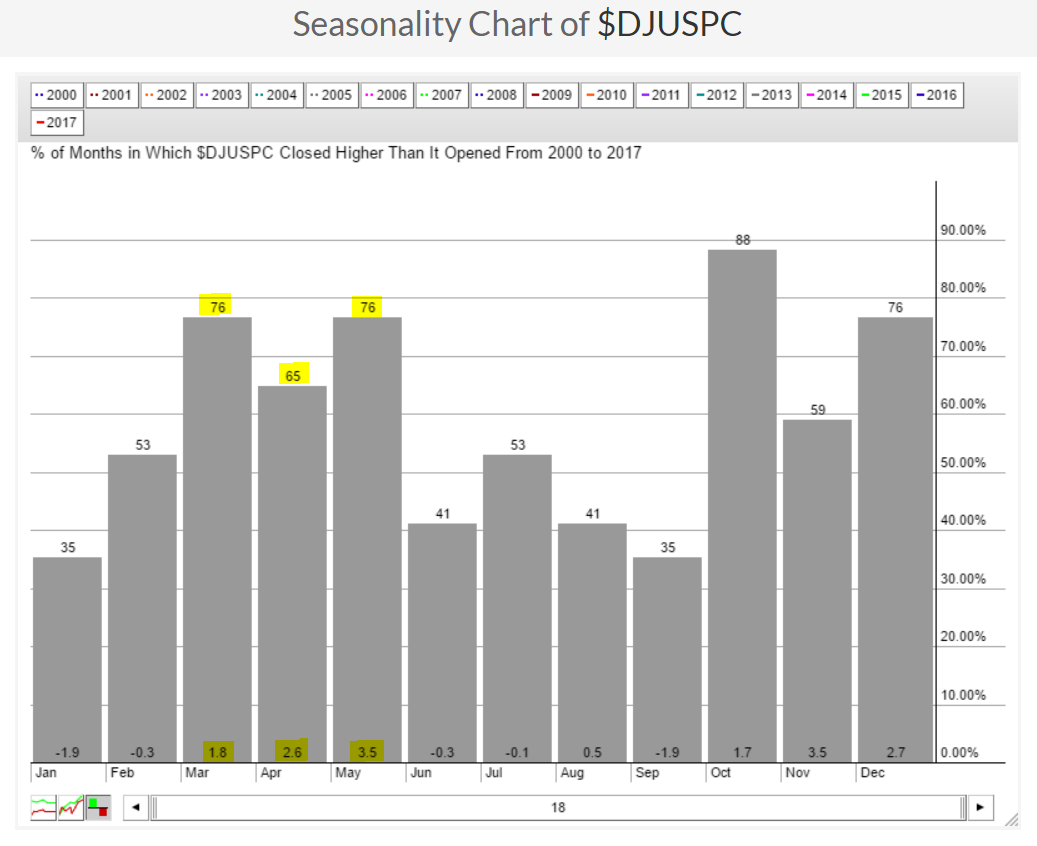 The March to May period rivals that of October to December for the best historical period of the year.
Key Earnings Reports
(actual vs. estimate):
DAL: .82 vs .81
TSM: .61 vs .58
(reports after close, estimate provided):
INFY: .23
Key Economic Reports
Initial jobless claims released at 8:30am EST: 247,000 (actual) vs. 255,000 (estimate)
Happy trading!
Tom
