Market Recap for Friday, January 13, 2017
Friday may have seemed like a ho-hum kinda day as the Dow Jones actually finished with a loss for the session. But there was significant strength in both the more aggressive NASDAQ and Russell 2000, not to mention that the four sector leaders were financials (XLF, +0.56%), industrials (XLI, +0.38%), consumer discretionary (XLY, +0.37%) and technology (XLK, +0.30%). I love days where these four sectors lead the market. Making things even more bullish was the NASDAQ's breakout to another all-time high.
In the consumer discretionary space, the Dow Jones U.S. Footwear Index ($DJUSFT) recently broke to a three month and appears to be strengthening. Its bounce off the rising 20 day EMA adds to this bullishness. Check it out:
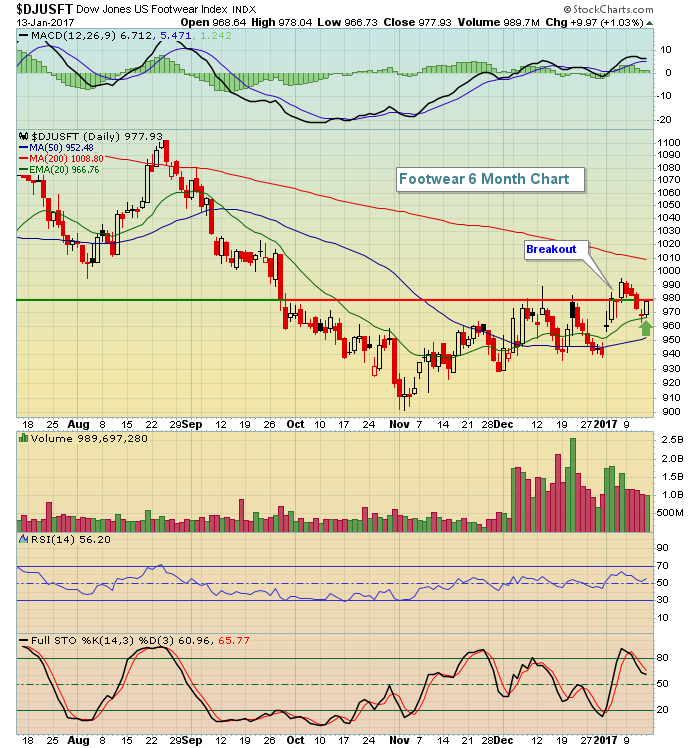 I'd definitely feel better about this industry if the rising 20 day EMA continues to hold as support (green arrow( and we see another breakout above the recent high.
Banks ($DJUSBK) saw several key earnings reports on Friday - all of which beat EPS estimates. The index attempted a breakout on very heavy volume, but came up short by day's end. I expect banks to perform very well in 2017 and a closing breakout would likely signal the next bullish run.
Pre-Market Action
We're seeing mixed global markets in both Asia and Europe this morning and Dow Jones futures are pointing lower. Dow futures are lower by 44 points just 30 minutes from the opening bell. Gold ($GOLD) and crude oil ($WTIC) are both higher on a day that could be led by energy and materials.
The 10 year treasury yield ($TNX) continues to hover just above the 2.30% level.
Current Outlook
On Saturday, Greg Schnell and I co-hosted a "2017 Stock Market Outlook". Please check out the video recording. If you're not a current member of StockCharts.com, sign up for a 10 day FREE trial so that you can watch. We took different angles in evaluating the U.S. stock market, along with other global indices. I highlighted a few warning signs that we saw before the last bear market began in 2007. Simply put, we need to be aware of significant rotation away from aggressive areas of the market. That rotation was a major problem as you can see below:
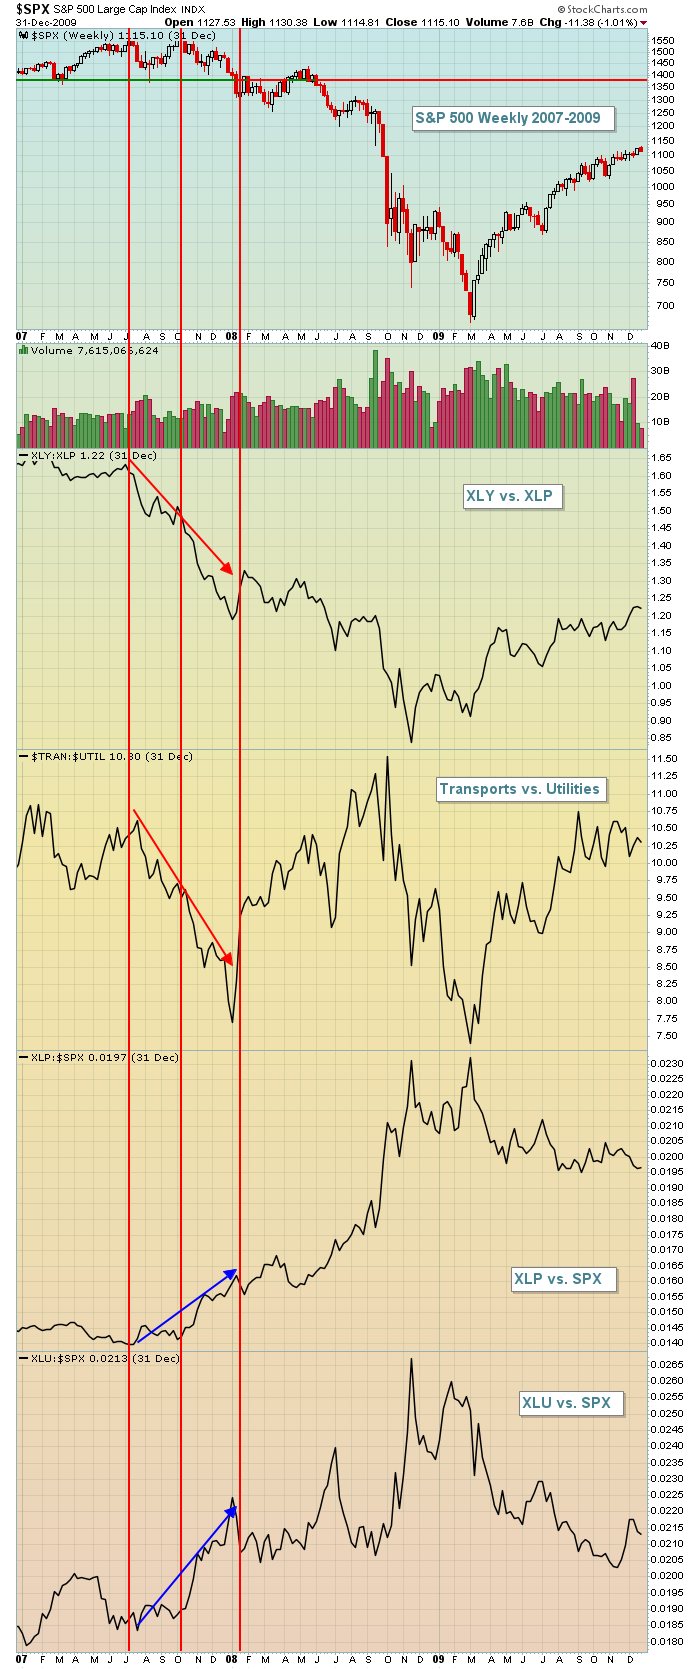 Note that back in 2007 the S&P 500 moved mostly sideways after topping in the summer. But check out what was taking place beneath the surface. Money was rotating significantly towards safety and away from riskier assets. That's what we need to be on the lookout for in 2017. Currently, the action remains bullish under the surface - especially druing this latest bull market rally. Check it out:
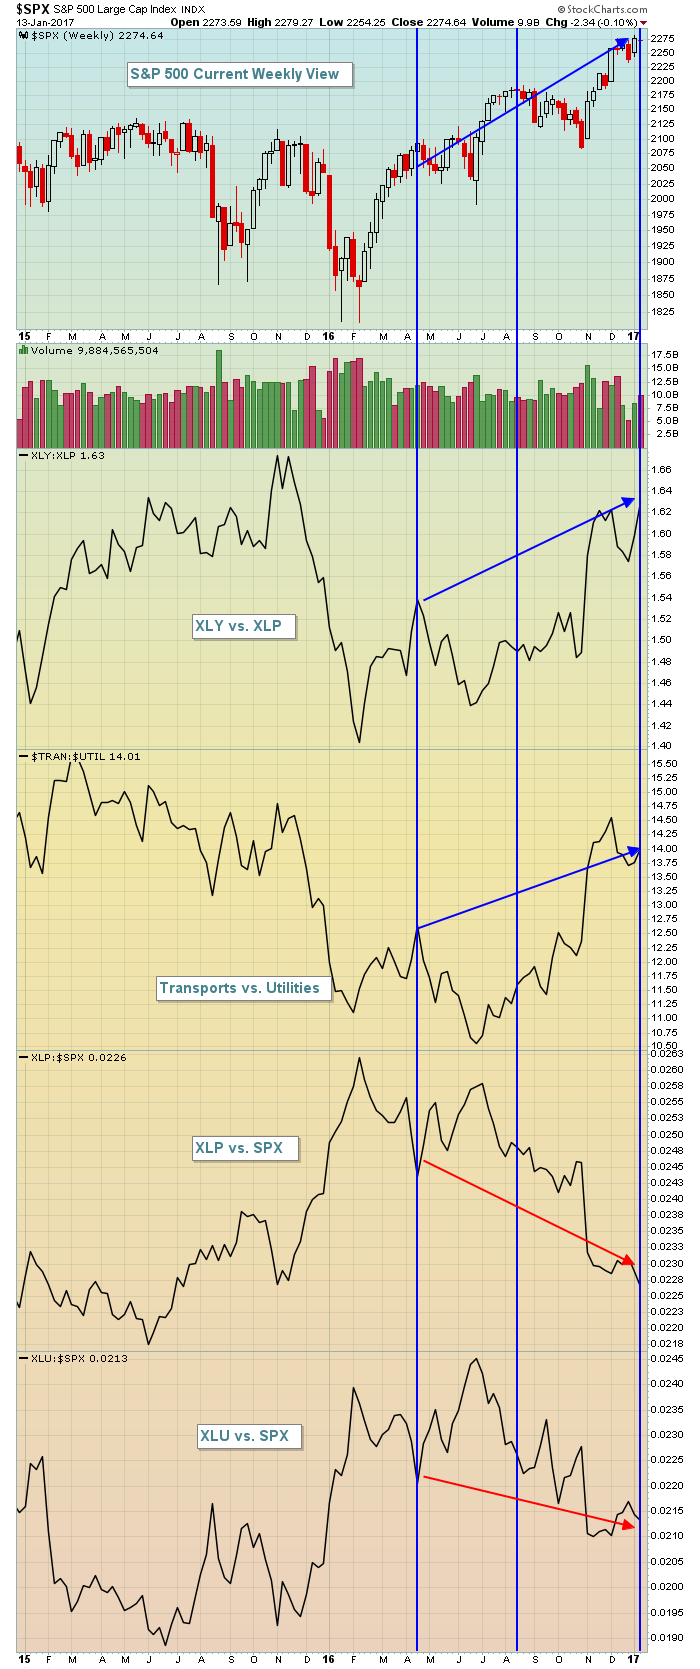 Aggressive money has been leading this rally while defensive areas of the market are losing ground to the S&P 500. This is bullish action. I believe the market will continue to perform well, with pullbacks along the way of course. However, if the S&P 500 pushes to new highs in the first quarter and we begin to see deterioration in these (and other) "beneath the surface" signals, I'd grow much more cautious.
Sector/Industry Watch
The Dow Jones U.S. Internet Index ($DJUSNS) has been rising strongly since falling back to test key price support at 1100. It's nearing a key price resistance, established on the late October high. A breakout would add to the bullishness in technology. Check this out:
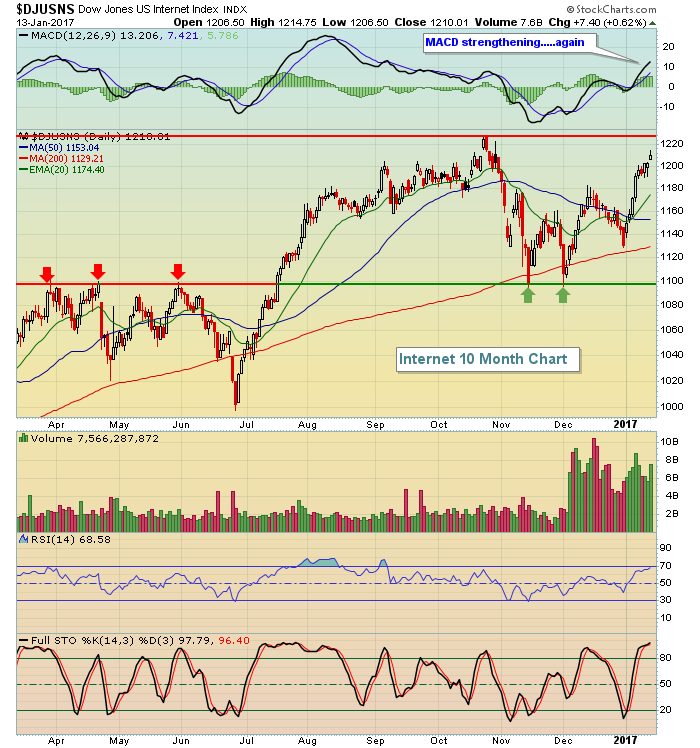 There's one historical component that we need to remember. January and February are not typically the best months for bullish internet behavior. So if the breakout fails at that October high, we could see sideways consolidation for an extended period. Upcoming earnings reports in the group will likely dictate the group's direction over the next several weeks.
Historical Tendencies
Well, we're nearing the end of our historically bullish October 27th through January 19th period. The S&P 500 typically enjoys outperformance during this time frame and 2016-2017 has been no different. So, historically speaking, what should we expect? Once we get past the 19th, we generally see profit taking and that makes some sense as the inauguration approaches. Late January into the first week of February is a bullish period, but the middle part of February usually sees profit taking.
Key Earnings Reports
(actual vs. estimate):
CMA: .99 vs .95
MS: .81 vs .65
OZRK: .72 vs .69
UNH: 2.11 vs 2.07
(reports after close, estimate provided):
CSX: .49
UAL: 1.65
Key Economic Reports
January empire state manufacturing report released at 8:30am EST: 6.5 (actual) vs. 8.0 (estimate)
Happy trading!
Tom
