Market Recap for Monday, January 9, 2017
Dow 20k watchers were left hanging another day as the NASDAQ was the only major index to gain ground on Monday. And speaking of lone leaders, healthcare (XLV, +0.42%) was the only sector to post a gain as falling crude oil prices ($WTIC) sent energy shares (XLE, -1.48%) reeling to only their second close beneath their rising 20 day EMA since this major rally began in early November. Energy bulls will be under pressure to turn things around quickly or rely on the longer-term weekly chart for support. Take a look:
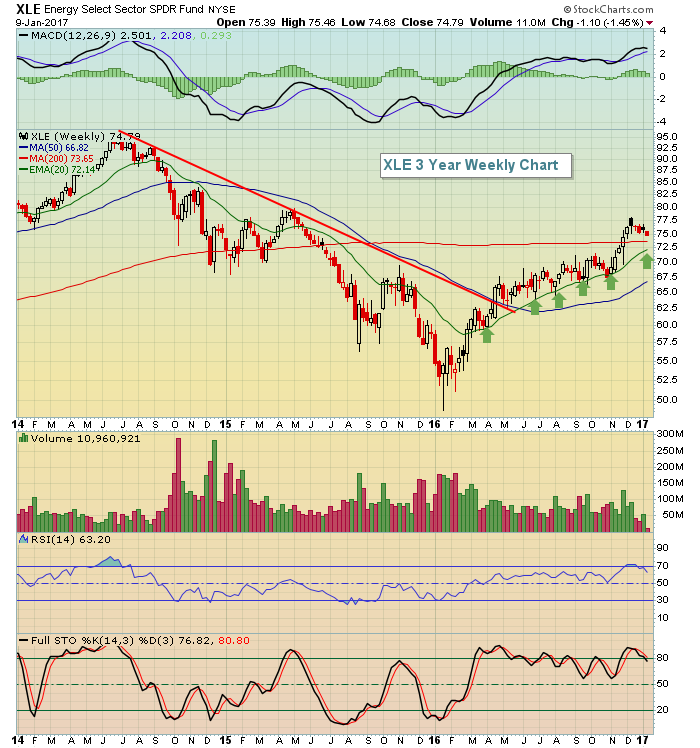 The rising 20 week EMA is just above 72.00 and you can see several successful tests of this key moving average throughout the current uptrend.
As for healthcare, biotechs ($DJUSBT) have opened the year on fire, with a gain of 6.45% in just one week. This biotech strength is the reason that healthcare too has led all sectors for the first week of January. None of this should be a surprise to historians as healthcare's best month of relative strength vs. the S&P 500 over the years has been January where it's outperformed the S&P 500 by an average of 1.7% over the last 20 years. I provided a summary of sector relative strength on a historical basis in my blog article on Saturday. CLICK HERE to review the spreadsheet that I included. Scroll down to the Historical Tendencies section below and you'll find out just how well biotechs perform relative to the S&P 500 in January. They're a beast in January.
Pre-Market Action
The Hang Seng Index ($HSI) jumped once again overnight and is now higher by nearly 6% since testing major price support at 21500. That's over the course of less than two weeks. Unfortunately, the Nikkei ($NIKK) dropped 150 points overnight, however, as that index is now battling with a negative divergence on its daily chart. We could see further struggles ahead there over the next couple weeks.
We're seeing fractional gains in Europe this morning. The German DAX ($DAX) also has posted a higher price recently with a weaker MACD so loss of 11400 (previous low before negative divergence formed) would likely see accelerated selling back to the 11000 area.
Here in the U.S. this morning, Dow Jones futures are down 19 points just 30 minutes before the opening bell.
Current Outlook
Through my experience, following certain ratios like consumer discretionary stocks vs. consumer staples stocks (XLY:XLP) and transportation stocks vs. utility stocks ($TRAN:$UTIL) can provide helpful clues as to the sustainability of a stock market rally. Don't listen to the cheerleaders on CNBC, listen to what the market is saying instead. These two simple ratios help to understand whether traders are willing to take risks and that is at the heart of bull markets. Trades need to be "risk on" trades. Below is a chart of the S&P 500, with these two key ratios shown just beneath. Take a look:
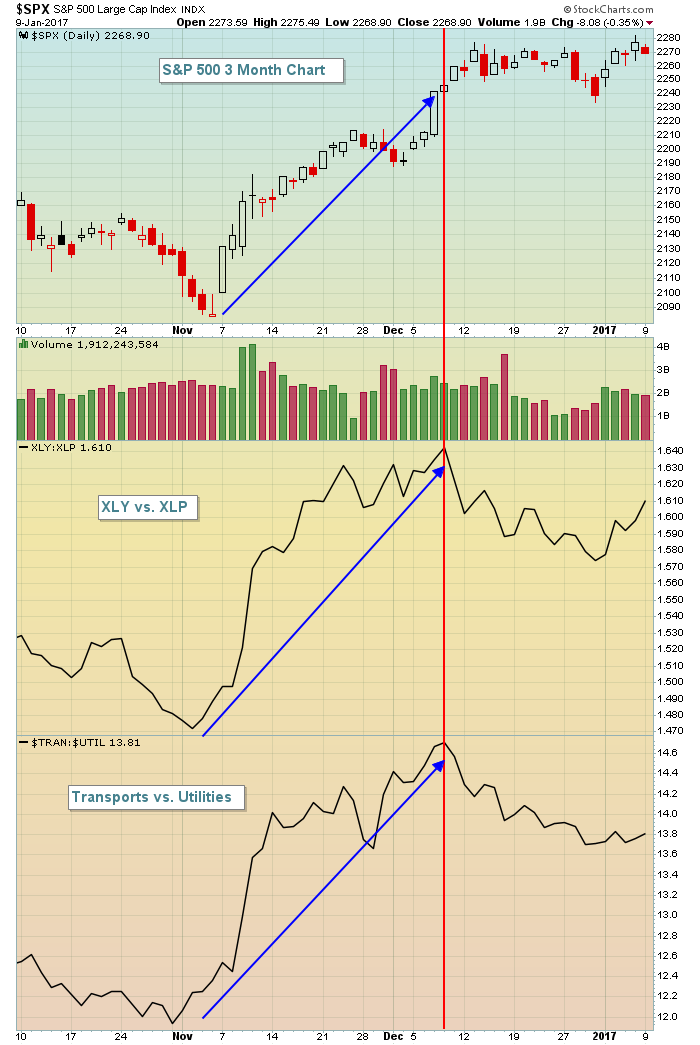 Throughout the majority of this rally, these two key relative ratios were moving up as well. This tells us that money is rotating into aggressive riskier areas of the market and therefore the rally is likely sustainable. But look at what has happened over the past month while the S&P 500 struggles. Money has turned more defensive while we consolidate. The longer-term issue arises if the S&P 500 makes new highs over months and months and these relative ratios fail to rise with it. And if the Volatility Index ($VIX) rises simultaneously to suggest more fear in the market, that could be an initial warning that we're potentially entering a bear market.
We're simply not there yet. I remain bullish.
Sector/Industry Watch
The Dow Jones U.S. Footwear Index ($DJUSFT) has opened 2017 as one of the strongest components in the consumer discretionary (XLY) sector. This is noteworthy because there's an interesting relationship between Skechers (SKX) and Nike (NKE) as you can see below:
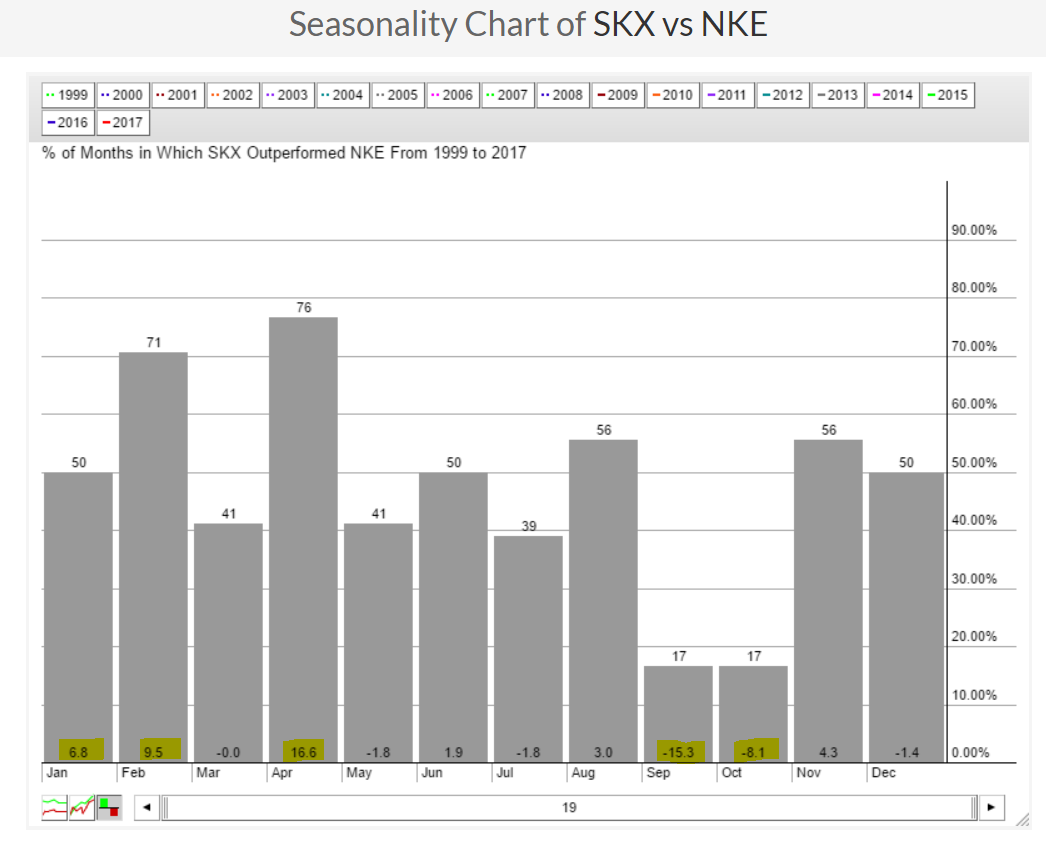 For whatever reason, SKX tends to outperform NKE through the first four calendar months of year in a big, big way. But if you fast forward to "back to school", check out the massive underperformance of SKX vs NKE in September and October. If you like the recent short-term breakout in the DJUSFT, then you might consider favoring SKX through April. Just sayin.....
Historical Tendencies
The Dow Jones U.S. Biotechnology Index ($DJUSBT) has begun 2017 on a very bullish note and one look at its historical strength vs. the S&P 500 will help to explain why. The following chart shows how the biotechs perform relative to the S&P 500 for every calendar month. Check it out and note January's relative strength:
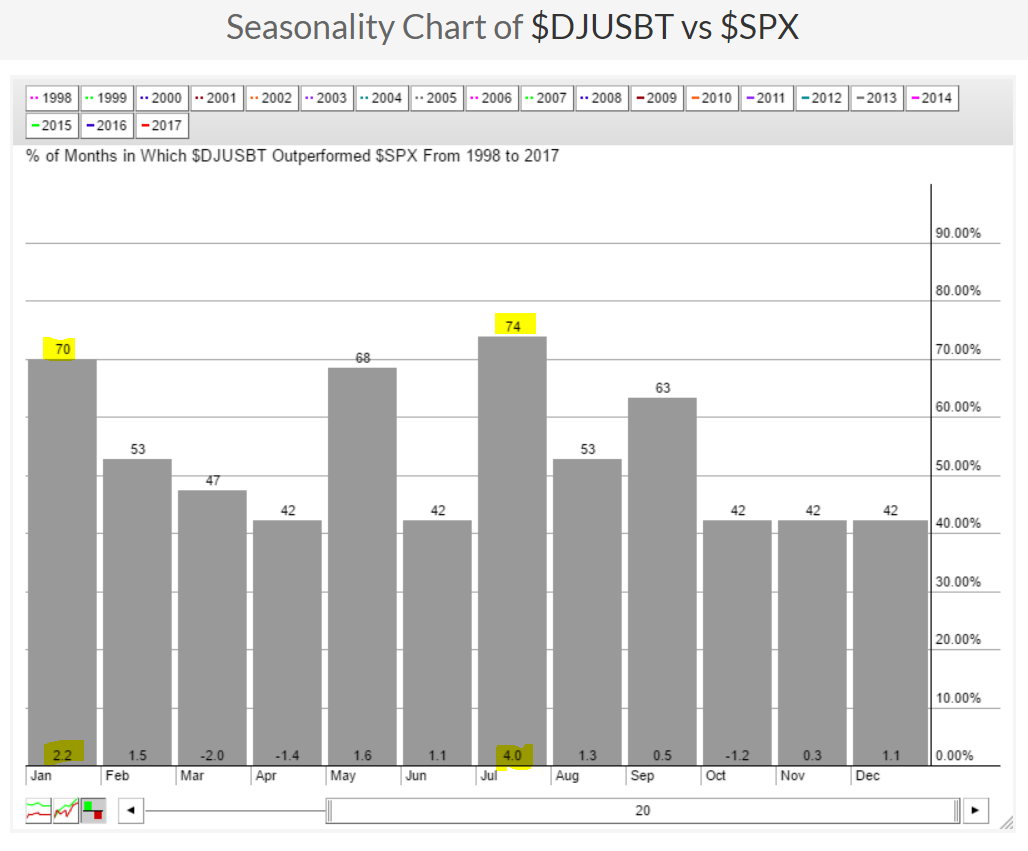 The only calendar month that shows more relative strength for the DJUSBT is July. There's significant strength in February as well so given historical strength, biotechs could challenge their 2016 highs near 1800 sooner rather than later.
Key Earnings Reports
None
Key Economic Reports
November wholesale inventories to be released at 10:00am EST: +0.9% (estimate)
Happy trading!
Tom
