Market Recap for Wednesday, February 22, 2017
Utilities (XLU, +0.42%) showed relative strength again on Wednesday, leading the charge on an otherwise bifurcated kinda day. The Dow Jones was able to finish the session with a gain, but the benchmark S&P 500, NASDAQ and Russell 2000 were all noticeably weaker, especially the latter as small caps lagged with a 0.46% decline.
The XLU has benefited from the inability of the 10 year treasury yield ($TNX) to sustain its rise from the fourth quarter of 2016. While the TNX has not broken down and, in fact, continues to consolidate in very bullish fashion, those seeking income have grown a bit impatient awaiting higher treasury yields and instead are opting for the high-yielding utilities group. I don't expect the recent leadership from utilities to continue as we're likely to see another push higher in treasury yields once this period of consolidation ends. Check out the TNX chart:
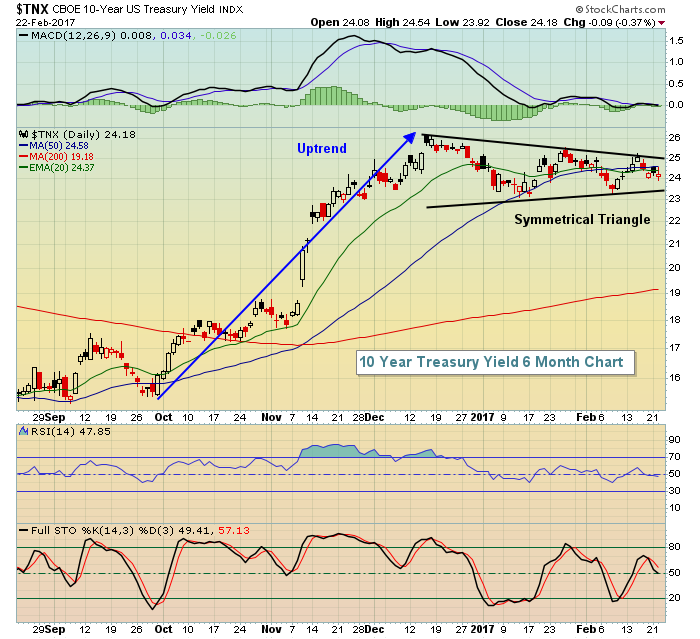 The uptrend in the TNX is obvious and symmetrical triangle continuation patterns tend to "continue" the prior trend. Therefore, the highest likelihood here is another breakout in yields to the upside, which is generally unfavorable for the utilities sector as it makes their dividend yields less attractive.
Materials also performed quite well on Wednesday with the Dow Jones U.S. Commodity Chemicals Index ($DJUSCC) the primary reason as this industry gained 1.49% on the session. Dow Chemical (DOW) and DuPont (DD) led the group with gains of 4.00% and 3.39%, respectively. After struggling to keep pace with the S&P 500 for two years, the DJUSCC is now leading that benchmark index. Have a look:
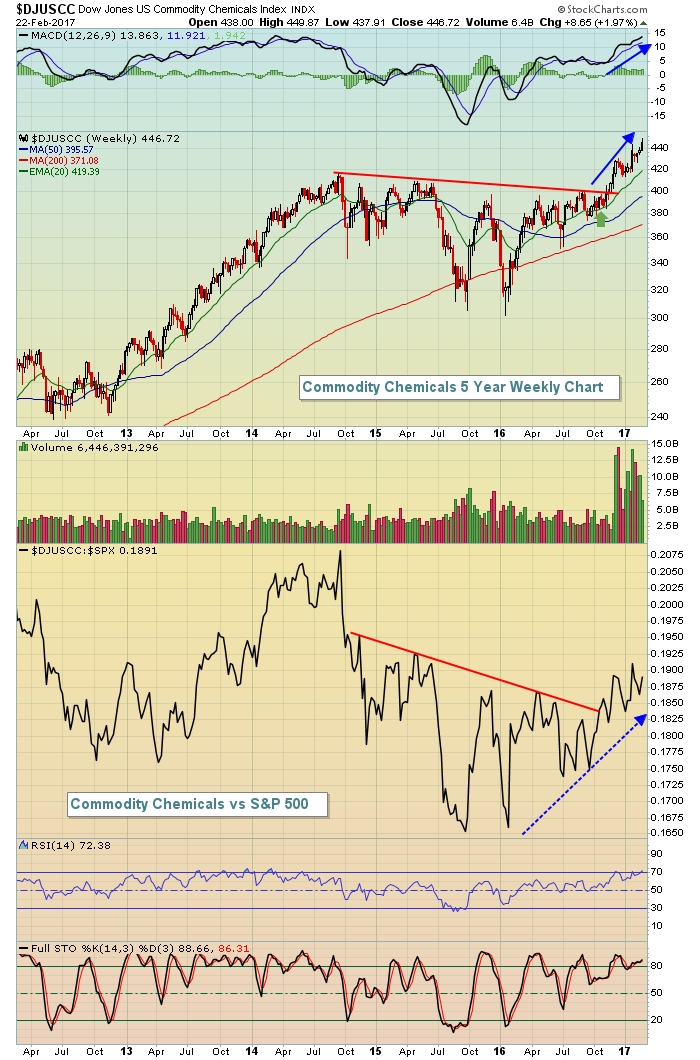 The absolute performance on the DJUSCC was rather abysmal for a couple years as the S&P 500 broke to new all time highs while commodity chemicals languished. That changed late in 2016 and the absolute breakout and strength has also corresponded with relative strength.
Pre-Market Action
Crude oil prices ($WTIC) are up over 2% this morning and that's providing tailwinds for the Dow Jones, where futures are up 36 points with 30 minutes left prior to the opening bell. Initial jobless claims came in exactly as expected at 244,000. Another key housing report is being released as I publish this article, with the FHFA home price index expected to rise 0.4%. The homebuilding area is looking for a catalyst for a major breakout, so watch this area closely.
In global markets, action overnight in Asia and this morning in Europe has been mixed and mostly flat.
Current Outlook
We've seen more defensive areas of the market leading lately, which is always a concern. But slowing momentum in key aggressive areas could be one of the problems and a big reason for relative strength in areas like utilities. As an example, let's take a look at transportation stocks ($TRAN). On its 60 minute chart, the most recent price high was accompanied by a lower high on its hourly MACD, resulting in a negative divergence. These shorter-term negative divergences tend to be an issue for a few days and that's been the case for the TRAN. Check it out:
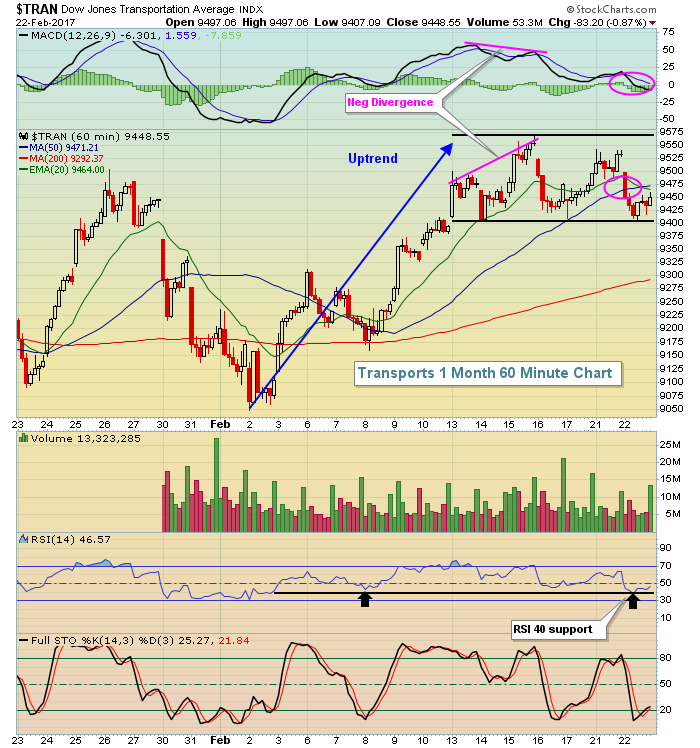 Once a negative divergence develops and price weakness begins, I look for 50 period SMAs and MACD centerline tests (pink circles above) to resolve the momentum issues. The MACD centerline represents, by definition, no momentum in either direction as shorter-term and longer-term moving averages used to calculate the MACD are the same at that point in time. Since the negative divergence printed, RSI dropped to test key 40 support and price support close to 9400 was tested as well. I'd expect this sideways consolidation (flag) to resolve to the upside - in the direction of the prior uptrend.
Sector/Industry Watch
The Dow Jones U.S. Transportation Services Index ($DJUSTS) appeared to be breaking out intraday on Wednesday, but ended up printing quite an ugly reversing candle (gravestone doji). Based on this reversal and failure after the breakout was made, I'd look for short-term weakness in this space. Momentum, however, is quite strong on both its daily and weekly charts so any weakness will most likely be followed up with a true breakout. Take a look:
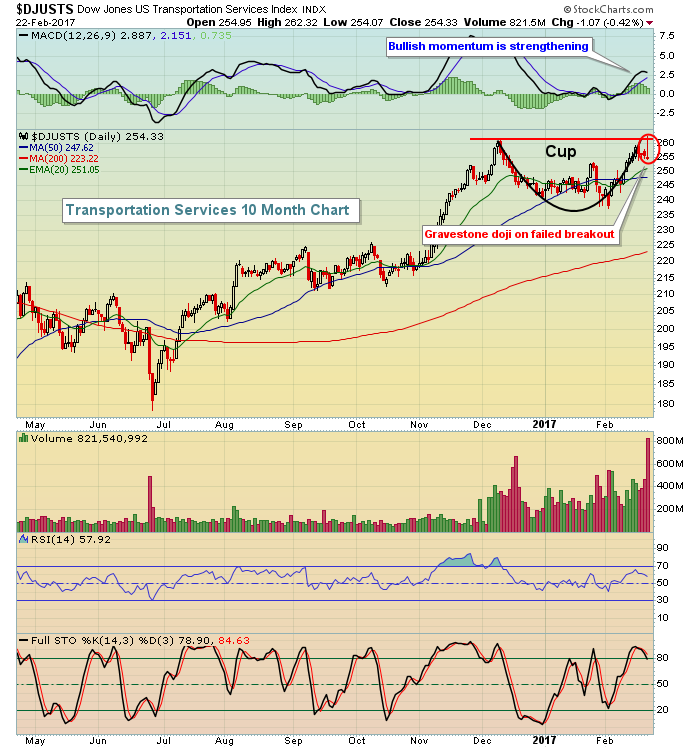 I'd expect one of two things to happen here. Given the strength of the MACD, it's typical to see pullbacks test the rising 20 day EMA, then take off. Based on the reversing candle, I'd look first for weakness down to test this rising 20 day EMA, currently at 251, and for that moving average to provide support for the bulls. Should the 20 day EMA fail, then a possible bullish rectangular consolidation (flag) could form with price action falling to test the early February low. In either case, I don't believe we've seen the short- to intermediate-term highs for the DJUSTS. Look for another breakout down the road.
Historical Tendencies
Real estate services ($DJUSES) is an industry group within the finance sector that is primed for a big move to the upside. Before we look at the chart, consider that it's by far the best performing industry during the month of March with average March gains of 9.5% over the past 9 years. Its average April gains of 7.8% rank it fourth among all industry groups in that month as well. But adding much more bullishness is that actual performance of the group of late, breaking out. Here's the visual:
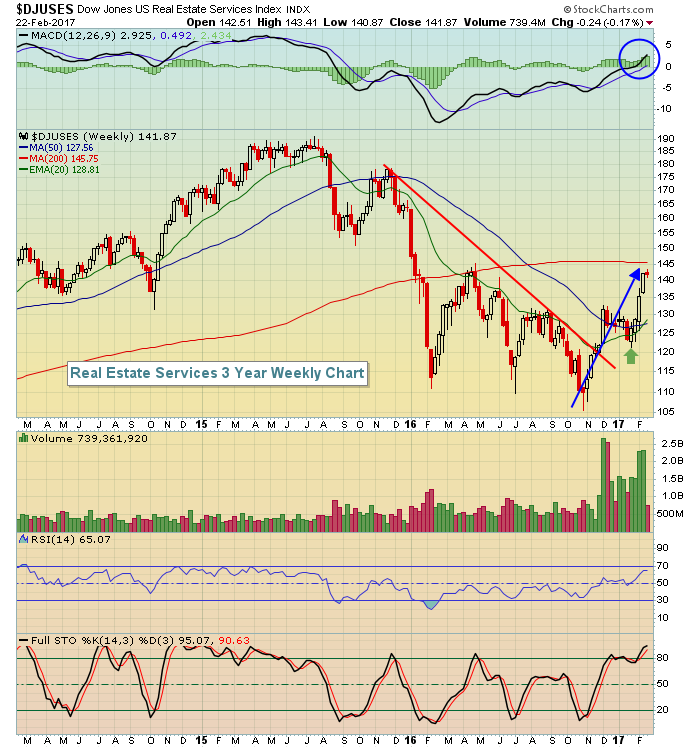 With the weekly MACD crossing above centerline resistance for the first time in 18 months, it appears that technically this group is just getting started. Thow in the seasonal strength and I think we have a winner for the next two months.
Key Earnings Reports
(actual vs. estimate):
APA: (.06) vs .10
CHK: .07 vs .06
HRL: .44 vs .46
IRM: .50 vs .45
KSS: 1.44 vs 1.32
LKQ: .35 vs .39
PDCO: .58 vs .57
VALE: .53 vs .35
(reports after close, estimate provided):
BIDU: .93
BMRN: (.40)
GPS: .51
HPE: .44
INTU: .06
JWN: 1.14
MELI: .90
SPLK: (.57)
Key Economic Reports
Initial jobless claims released at 8:30am EST: 244,000 (actual) vs. 244,000 (estimate)
December FHFA home price index to be released at 9:00am EST: +0.4% (estimate)
Happy trading!
Tom
