Market Recap for Wednesday, February 8, 2017
The 10 year treasury yield ($TNX) has dropped back toward the lower end of its 2-3 month trading range from 2.30% to 2.60%, closing on Wednesday at 2.35%. That apparently has been enough to spark utilities (XLU, +0.98%) as this defensive sector trails only consumer staples (XLP, +0.41%) in terms of its one week performance. Here's the latest daily chart on the XLU:
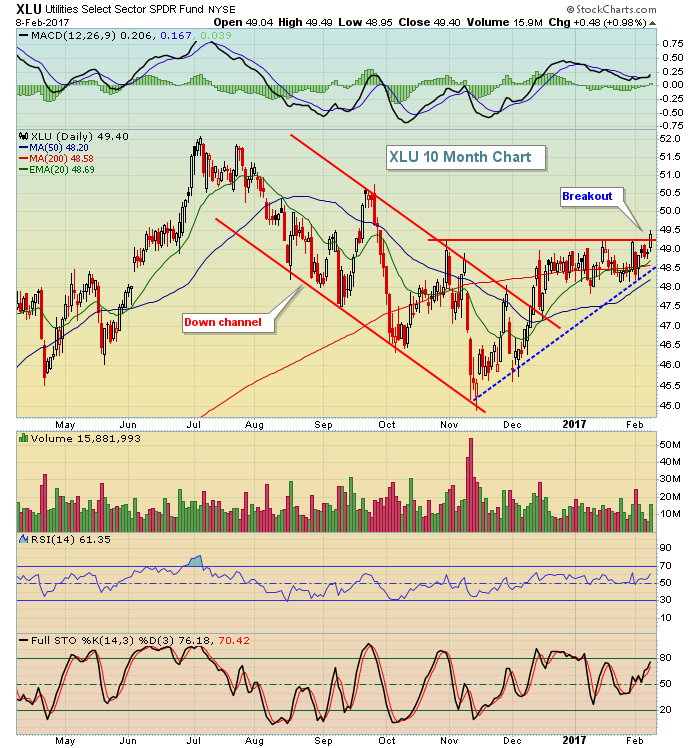 It'll be interesting to see if this breakout results in an extended uptrend given the fact that the TNX remains in an intermediate-term uptrend.
Consumer staples saw relative strength again on Wednesday, led by two groups - tires ($DJUSTR) and clothing & accessories ($DJUSCF) - that have been heading in different directions. I featured the DJUSCF in yesterday's article, pointing out that the group was closing in on multi-year price support and the fact that February through April tend to be extremely bullish historically for the group. The DJUSTR remains in a nice uptrend and I'd expect more strength from this industry in the near-term. Check out the chart:
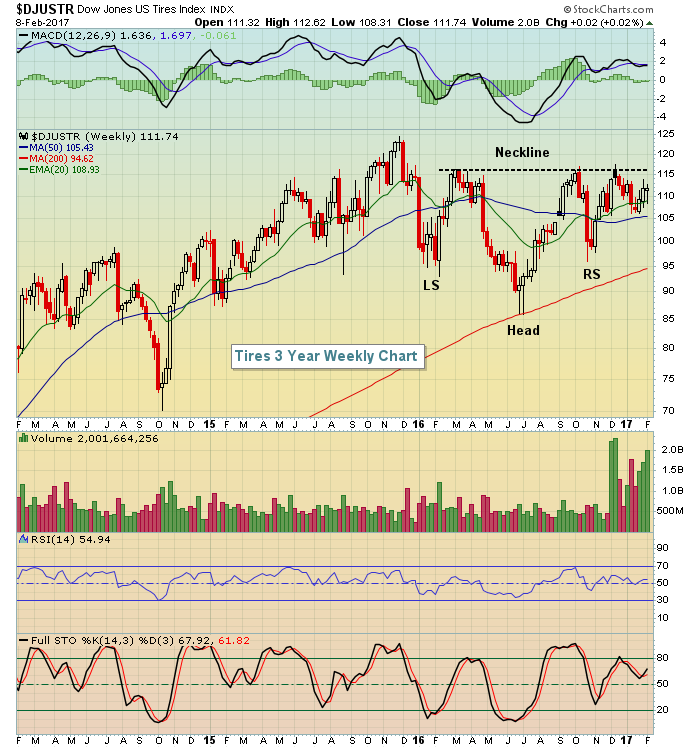 The inverse head & shoulders above is a continuation pattern that suggests the next move in tires will be higher. A close above 116-117 on increasing volume would confirm the pattern.
Pre-Market Action
Crude oil ($WTIC) is up approximately 1% this morning, lifting U.S. futures slightly above the flat line. Asian markets were mixed overnight while European stocks are mostly higher.
The 10 year treasury yield ($TNX) is up slightly to 2.36% on the heels of a better than expected initial jobless claims number this morning.
NVIDIA Corp (NVDA), one of the strongest stocks in the market over the past year, reports its latest quarterly earnings today after the closing bell.
Current Outlook
The S&P 400 Mid Cap Index ($MID) has been consolidating in a bullish symmetrical triangle for the past couple weeks. This doesn't provide us any long-term clues, but does suggest that the next short-term move is likely to be higher. Take a look at the pattern:
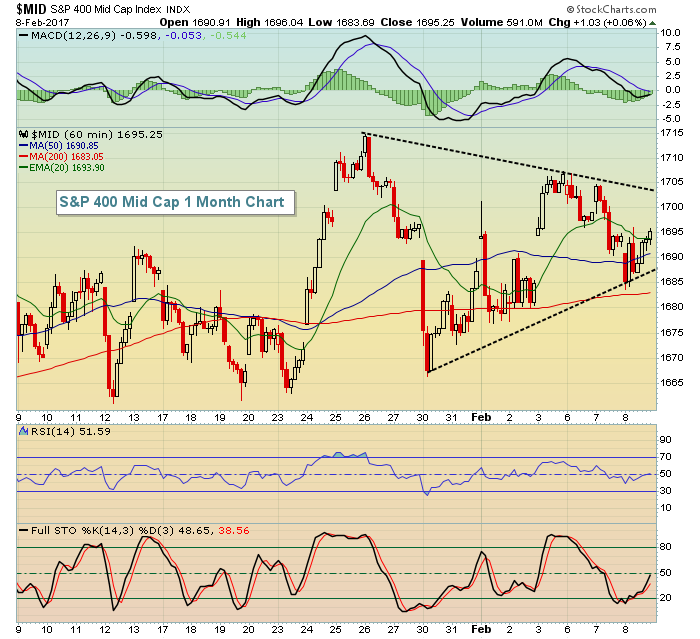 While the $MID has been mostly consolidating for the past two months, the latest move higher in late January has been followed by lower highs and higher lows, squeezing in this triangle formation. I expect to see a breakout before a breakdown.
Sector/Industry Watch
Recently, I discussed the historical bullish nature of toy stocks ($DJUSTY) during the calendar months of February and March. I also suggested that the weekly negative divergence that had printed in September and October had been resolved with 50 week SMA and MACD centerline tests. The group is now strengthening and appears to be putting in the right side of a cup. Check out the latest:
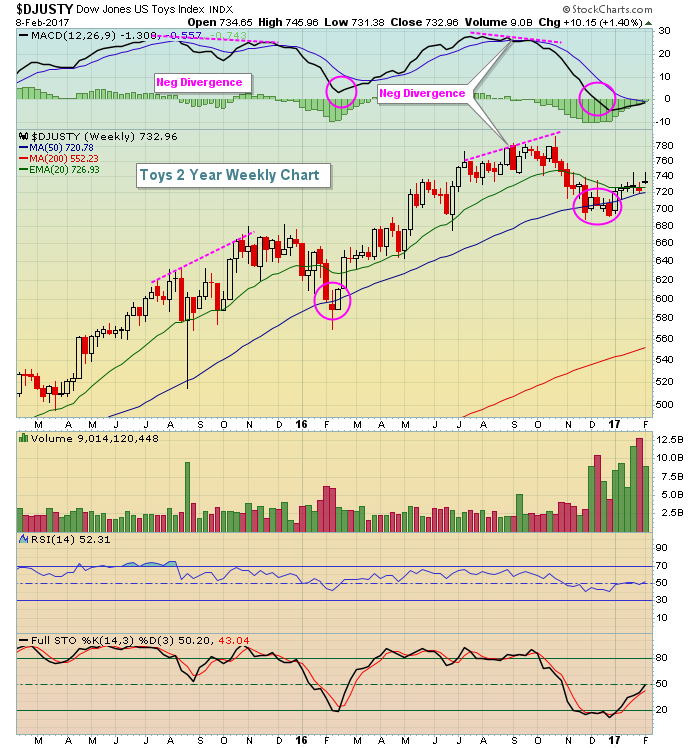 Negative divergences on weekly charts really need to be respected as they typically lead to an extended period of absolute and relative weakness. That's been the case with toys twice in the past two years, but the group now appears to be heading back to test its recent highs near 780.
Historical Tendencies
The first half of February tends to be the most bullish half of the month for the S&P 500. Since 1950, the following represents the breakdown of performance by each half of February:
February 1-15: +7.65%
February 16-29: -7.87%
Key Earnings Reports
(actual vs. estimate):
BWA: .85 vs .84
CMI: 2.25 vs 2.02
COTY: .30 vs .35
CVS: 1.71 vs 1.67
DTE: .81 vs .84
K: .92 vs .85
KO: .37 vs .36
MAS: .33 vs .34
NLSN: .44 vs .77
OXY: (.13) vs (.02)
RAI: .62 vs .60
REGN: 2.19 vs 2.51
ROP: 1.86 vs 1.82
SEE: .76 vs .75
TOT: .96 vs .92
TRI: .60 vs .58
TU: .40 vs .46
TWTR: (.03) vs (.11)
VIAB: 1.04 vs .82
WYNN: .50 vs .67
YUM: .79 vs .72
(reports after close, estimate provided):
AGU: .65
ATVI: .72
CERN: .57
EXPE: 1.10
MHK: 3.22
NVDA: .83
SGEN: (.34)
VRSN: .79
Key Economic Reports
Initial jobless claims released at 8:30am EST: 234,000 (actual) vs. 250,000 (estimate)
December wholesale inventories to be released at 10:00am EST: +1.0% (estimate)
Happy trading!
Tom
