Market Recap for Friday, February 24, 2017
The 10 year treasury yield ($TNX) tumbled 7 basis points on Friday and that continued the recent string of solid days for utilities (XLU, +1.52%). Healthcare (XLV, +0.48%) is also benefiting from the rotation to defensive areas of the market as the XLV has been the best performing sector over the last 30 days with a gain of 8.27%. Utilities aren't far behind, gaining 6.63% over that span. The XLV could run into price resistance difficulties, however, as it's nearing its August 2016 closing high of 75.06. Take a look:
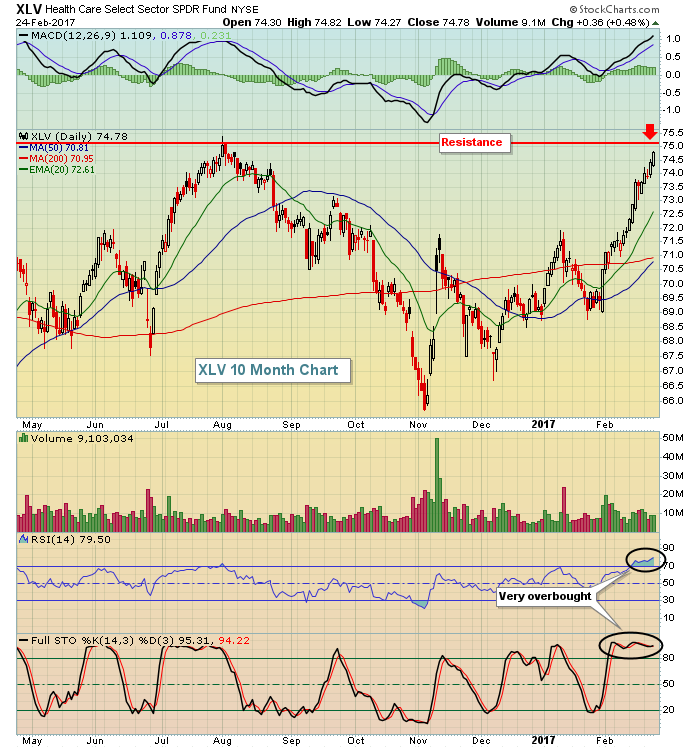 The rally in healthcare has been with little pause and you can see above how overbought the group is with its RSI and stochastic at 79 and 95, respectively. That's very overbought so I'd expect price resistance to curb the enthusiasm for the space. The rising 20 day EMA would likely provide solid support during any consolidation period.
Energy (XLE, -0.93%) and financials (XLF, -0.77%) were the laggards on Friday, with the former continuing to battle at key support in the 70-71 range. The weakness in financials could be setting up a nice opportunity in certain areas, one of which is the Dow Jones U.S. Hotel & Lodging REITs Index ($DJUSHL). The DJUSHL is featured below in the Sector/Industry Watch section.
Pre-Market Action
Crude oil ($WTIC) is up nearly 1% this morning, but weakness in Asia overnight and a mostly flat European market is not exciting investors here in the U.S. as we approach a new trading week. Dow Jones futures are down 13 points.
Current Outlook
The 10 year treasury yield ($TNX) peaked in mid-December and has trended lower ever since. It has, however, held its recent trading range from 2.30%-2.60% after a significant rise. So I'd say the odds are quite strong that the TNX will hold 2.30%, but if it doesn't it likely will impact interest-sensitive areas in a negative way. Banks ($DJUSBK) and insurance companies ($DJUSIL) would be likely targets of the sellers so be careful if the TNX breaks down. Here's the current chart on the TNX:
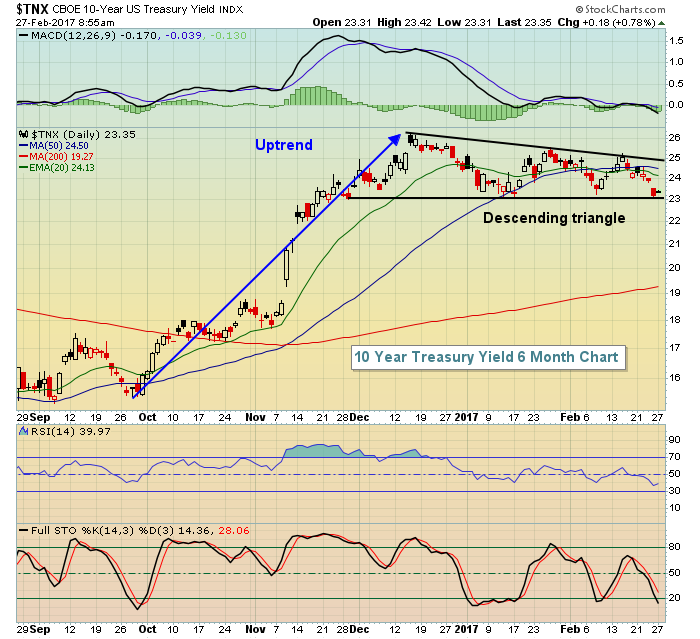 Descending triangles are bearish patterns, but I've found they're mostly bearish when following a downtrend - similar to an ascending triangle that follows an uptrend. I still expect this pattern to break to the upside and the TNX to challenge 2.60%. I do think the recent rotation to defensive areas would be further confirmed by a breakdown in treasury yields, though, so be careful if the TNX closes beneath 2.30%.
Sector/Industry Watch
The DJUSHL mentioned above in the Market Recap section printed a probable bottom on Friday at key price support. It looked like it could be breaking down below price support at 116-117 on an intraday basis Friday, but recovered by the close to hold onto that key level. Here's the visual:
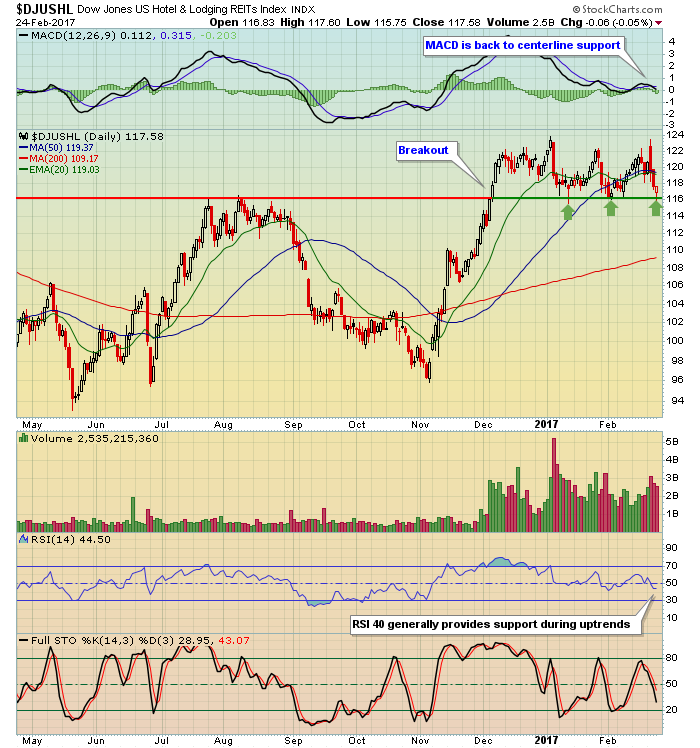 The DJUSHL was very overbought in December and this demonstrates the risks of making new investments in groups that are overbought. Your money can sit and sit and sit while a group consolidates. However, the recent weakness to price support provides a much better reward to risk entry into this industry. A break below 116 could signal a quick exit to minimize losses while holding this support level could provide immediate positive returns. I look for RSI levels from 40-50 during uptrends for entry and the DJUSHL provides that currently.
I've received comments from some of you in the past that you can't invest in these indices, so how can you take advantage of setups like this. Well, many times there isn't an ETF that tracks an index exactly, so you either need to find an ETF that performs somewhat comparably to an index - or trade individual stocks within an index. In the Monday Setup section below, I've highlighted one such stock from the DJUSHL as an example.
Monday Setup
So we know the DJUSHL is at near-term price support so it therefore makes technical sense to at least consider a trade from within that index if we can find one that sets up suitably. I believe Host Hotels & Resorts (HST) could be a stock that benefits from a reversal in the group. The current technical look is very similar to the overall DJUSHL:
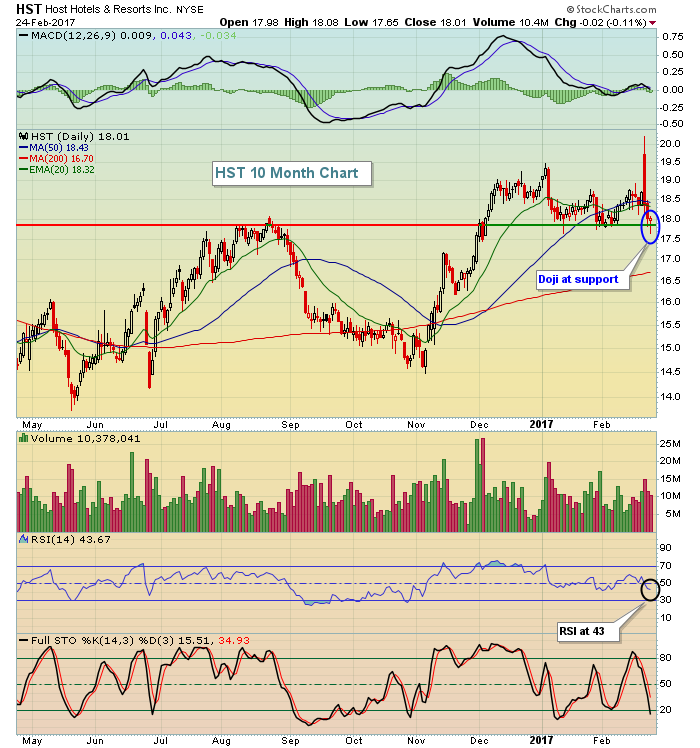 In the middle of last week, HST gapped higher to attempt a key price breakout but failed. It's since returned to price support that's held on previous tests. The RSI is at 43 and the doji on Friday suggests it may have bottomed in the near-term. Consider a closing stop beneath 17.60 with a target near 20.00.
I'll provide additional setups in my Trading Places LIVE webinar that begins at 1pm EST. You can CLICK HERE to register and join me. This webinar does require a StockCharts.com membership, however, so if you're currently a non-member, you can take advantage of the recently introduced ONE MONTH FREE TRIAL and join me. I'd love to see you there!
Historical Tendencies
I featured HST above as a possible trading candidate. Seasonality also favors an investment in HST. Of course, this does not provide guarantees of a profitable trade, but odds are setting positively for one. Here's how HST has performed on a calendar month basis over the past two decades:
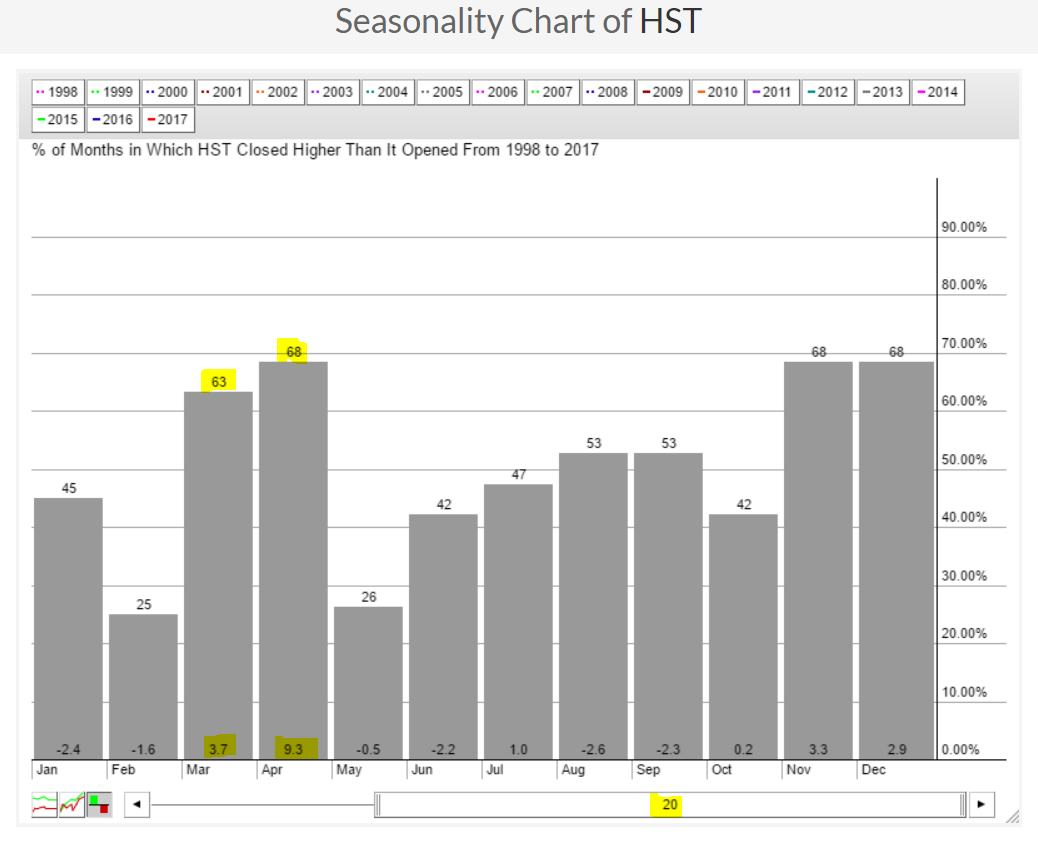 March and April provide the best consecutive average monthly gains throughout the year for HST. Knowing that the technical picture is strong and that HST is at key price support adds to the bullish case here.
Key Earnings Reports
(actual vs. estimate):
AES: .35 vs .36
AMT: 1.47 vs 1.43
(reports after close, estimate provided):
ALB: .75
EOG: (.16)
OKE: .47
OKS: .65
PCLN: 13.06
PRGO: 1.62
SBAC: .11
WDAY: (.50)
Key Economic Reports
January durable goods released at 8:30am EST: +1.8% (actual) vs. +1.8% (estimate)
January durable goods ex-transports released at 8:30am EST: -0.2% (actual) vs. +0.5% (estimate)
Happy trading!
Tom
