Market Recap for Tuesday, March 28, 2017
The bullish action couldn't have been much better on Tuesday. Money clearly rotated back to aggressive areas of the market as the Dow Jones advanced for the first time in the last nine trading sessions. This bullish rotation will be key should we see another break to all-time highs on our major indices. Technically, we just saw 50 day SMA tests on the Dow Jones, S&P 500 and NASDAQ for the first time since this bull market rally began in November 2016. The Dow's losing streak enabled its RSI to fall from the mid-80s to open March to a low of 40 yesterday. The strength we saw yesterday also followed the bullish reversing candle that had printed on Monday. Take a look at the DIA (ETF that tracks the Dow Jones) chart:
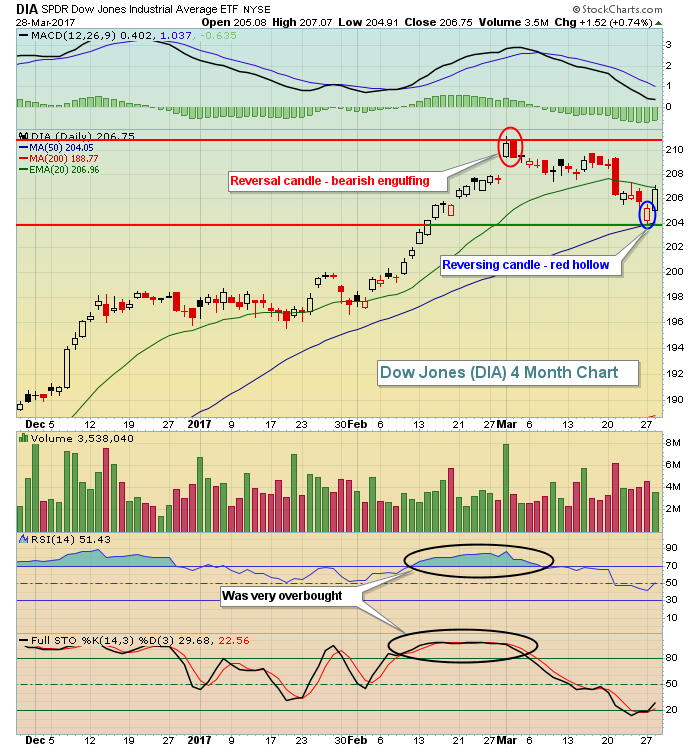 The Dow Jones was in very bad need technically for a period of profit taking and consolidation. The recent losing streak gave the bulls exactly what they needed and we saw a swift rebound on Tuesday, led by aggressive sectors.
Energy (XLE, +1.42%) and financials (XLF, +1.36%) were the two strongest sectors, while the three defensive groups - utilities (XLU, -0.08%), healthcare (XLV, +0.07%) and consumer staples (+0.18%) - trailed on a relative basis. It appears that positive divergences are beginning to emerge in the energy space as the following exploration & production index ($DJUSOS) reflects:
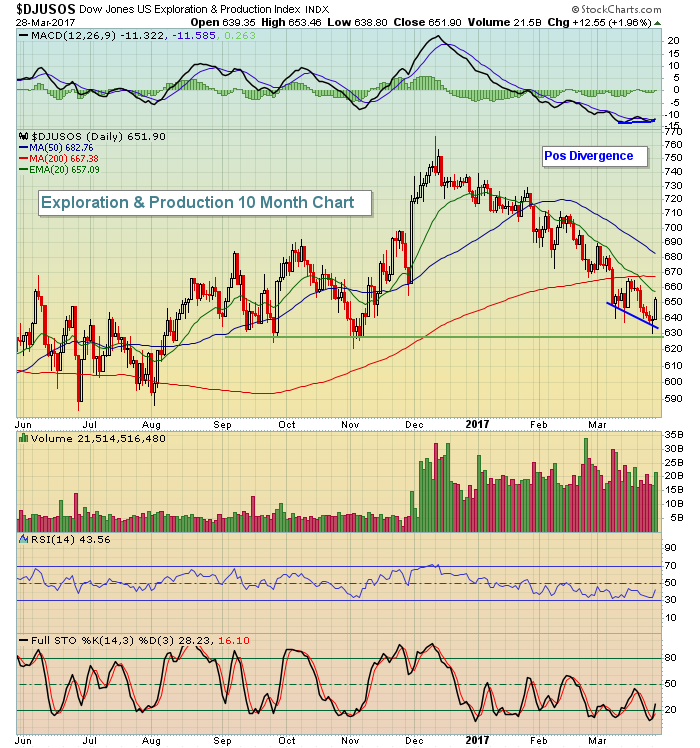 Hitting support near 630 with slowing selling momentum didn't hurt the group for sure. With the positive divergence in place, it's very possible that we'll see a 50 day SMA test on the DJUSOS, currently at 683.
Pre-Market Action
Asian shares were mostly flat overnight and Europe's primary strength is coming in Germany where the DAX is up roughly .50% this morning. Futures here in the US are fairly flat as well, although there appears to be continuing strength in NASDAQ shares with NASDAQ futures up 7 points with 30 minutes left to the opening bell.
The 10 year treasury yield ($TNX) rebounded above 2.40% on Tuesday, helping to lift financial stocks. Thus far this morning, the TNX is down one basis point to 2.40%. Financial shares will once again be looking to a rising yield for further strength.
Current Outlook
I always keep one eye on relative ratios to see if money is rotating toward aggressive areas. While yesterday's action was clearly bullish with aggressive areas attracting more than their fair share of money, the RUT:SPX ratio has been in a steady downtrend and I'm watching to see if this relative down channel breaks to the upside. There's a relative positive divergence that's formed so the likelihood of a relative rally in small cap shares is improving in my opinion. Here's the current look:
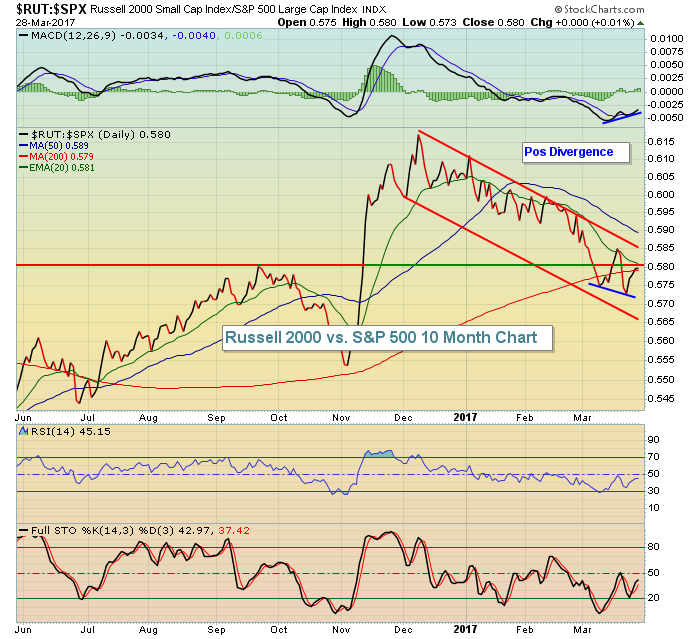 A breakout above .585 would be extremely bullish to support another breakout to all-time highs on the S&P 500. Let's keep watching.
Sector/Industry Watch
The Dow Jones U.S. Waste & Disposal Services Index ($DJUSPC) recently printed a negative divergence on its latest high and we saw selling down close to price support and its rising 50 day SMA. Based on the bullish engulfing candle that printed, I suspect we'll see more strength ahead. Take a look:
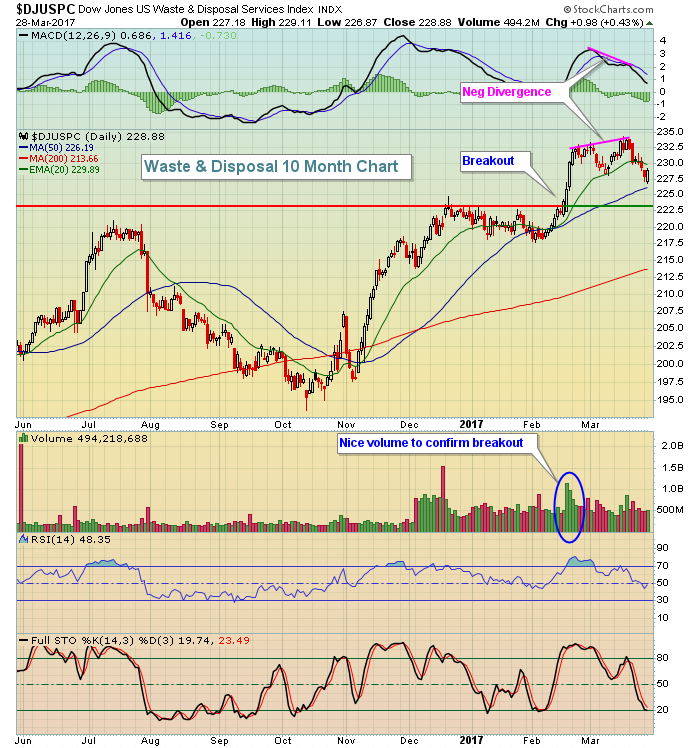 Overbought conditions, along with a negative divergence, are a major warning sign in the near-term. But the DJUSPC has seen its RSI dip back into the 40s and the near 50 day SMA test has almost reset the MACD to its centerline support.
Historical Tendencies
I've discussed on many occasions how powerfully bullish the stock market tends to be from the 28th of the calendar month to the 6th (even though the end of March tends to be somewhat flat). Overall, the strength at the end of the calendar month is apparent. Check it out:
28th: +21.68%
29th: +19.18%
30th: +9.74%
31st: +48.98%
Those are the annualized returns on the NASDAQ since 1971. The first six days of the following calendar month are even more bullish. Yesterday was the 28th.
Key Earnings Reports
(actual vs. estimate):
PAYX: .54 (estimate - actual not seen yet)
(reports after close, estimate provided):
LULU: 1.01
Key Economic Reports
February pending home sales to be released at 10:00am EST: +2.4% (estimate)
Happy trading!
Tom
