Market Recap for Monday, March 13, 2017
There really was very little movement in our major indices or in our sectors on Monday - which for Monday isn't really a bad day. But my guess is that traders are a bit cautious ahead of what many perceive will be another rate hike on Wednesday. I believe the hike is a foregone conclusion, so I'll be paying more attention to what Fed Chair Yellen has to say about the Fed's thoughts about the balance of 2017. It's a guess on my part, but look for the Fed to keep its hawkish tone.
I wrote a few days ago about weakening commodities, but the materials sector (XLB, +0.29%) led the market on Monday and is still holding on to its bullish technical pattern. Here's an updated look at the XLB:
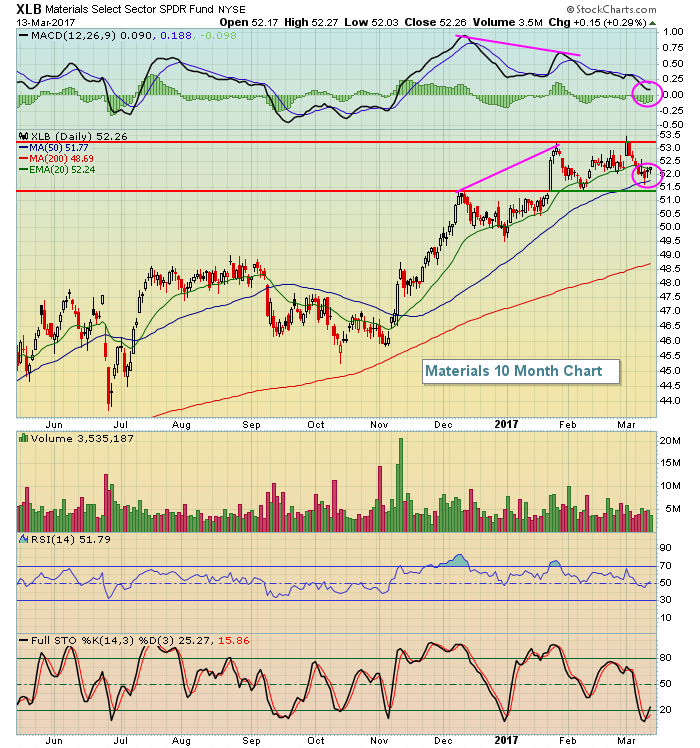 A negative divergence had formed in January and you can see its breakout attempt in February failed. That led to the recent weakness and the 50 day SMA test. Note also that the daily MACD fell back close to centerline support for a reset. Those two occurrences are marked with pink circles.
Pre-Market Action
Overnight, Asian markets were mostly unchanged and in Europe this morning there are fractional losses as well. That's led to a not-so-inspiring U.S. market with the Dow Jones futures down 51 points as we approach the opening bell - just 30 minutes away.
The 10 year treasury yield ($TNX) is at 2.61%, hovering just below major yield resistance at 2.62% as the FOMC meeting begins today. The announcement will be at 2pm EST tomorrow.
Current Outlook
I look at relative ratios to get a sense of what's taking place beneath the surface of the market. When relative ratios are weak, I get nervous and cautious. That does not mean I'm bearish. There's a big, big difference there. The only thing that truly makes me bearish is a breakdown in major price support with heavier than normal volume. One reason to be cautious right now has been the relative weakness in transports vs. utilities ($TRAN:$UTIL). The chart below shows that this ratio has been deteriorating despite a transportation group that has not broken down on an absolute basis. Check out this chart:
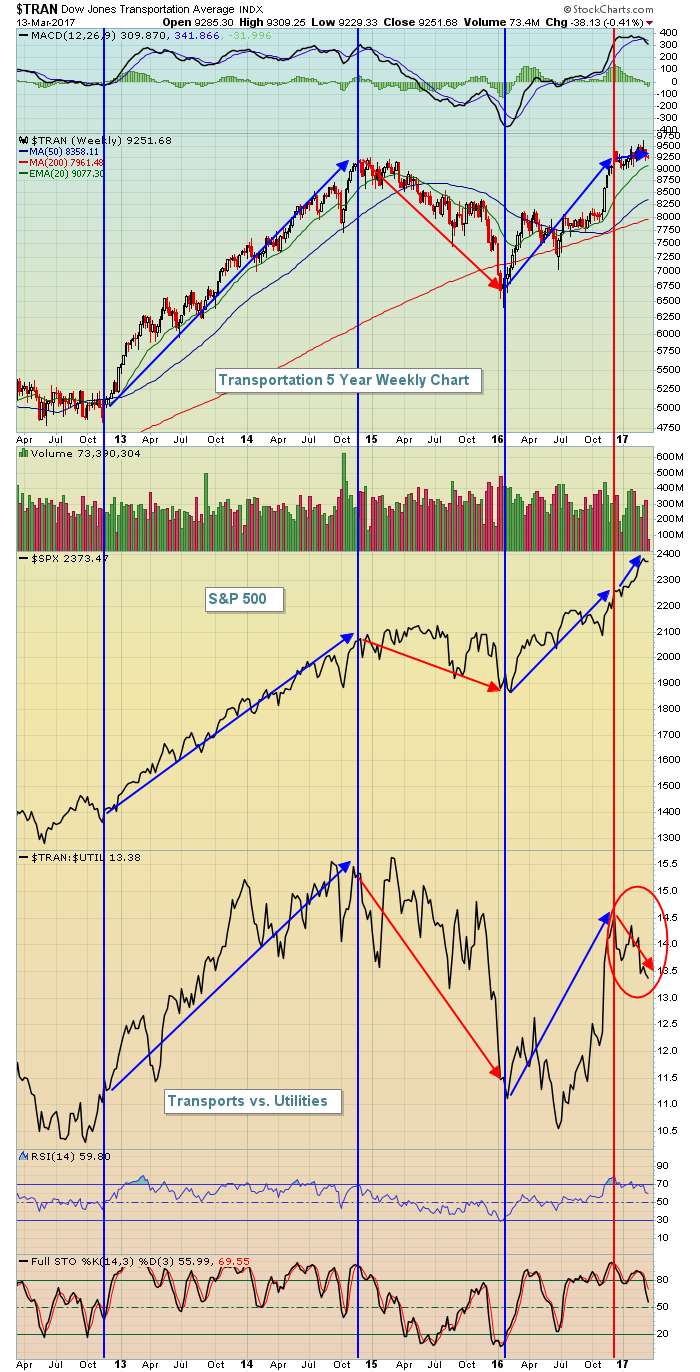 The above chart simply compares transportation stock ($TRAN) performance to the benchmark S&P 500 index ($SPX) and the relative ratio of transports to utilities ($TRAN:$UTIL). Note that the three tend to move in the same direction. However, the red circle above highlights the relative weakness of transports vs. utilities at the moment. That can change and a resurgence in this ratio to the upside would make me feel better about the sustainability of this bull market rally.
Sector/Industry Watch
The Dow Jones U.S. Footwear Index ($DJUSFT) has strengthened and now appears poised to help lead the consumer discretionary sector (XLY) higher. It wasn't long ago - perhaps November - that the toys industry ($DJUSTY) bottomed and turned higher to help keep the XLY afloat. Well, the DJUSFT had been downtrending much longer and this group seems to have turned the corner. Take a look at the longer-term downtrend channel break:
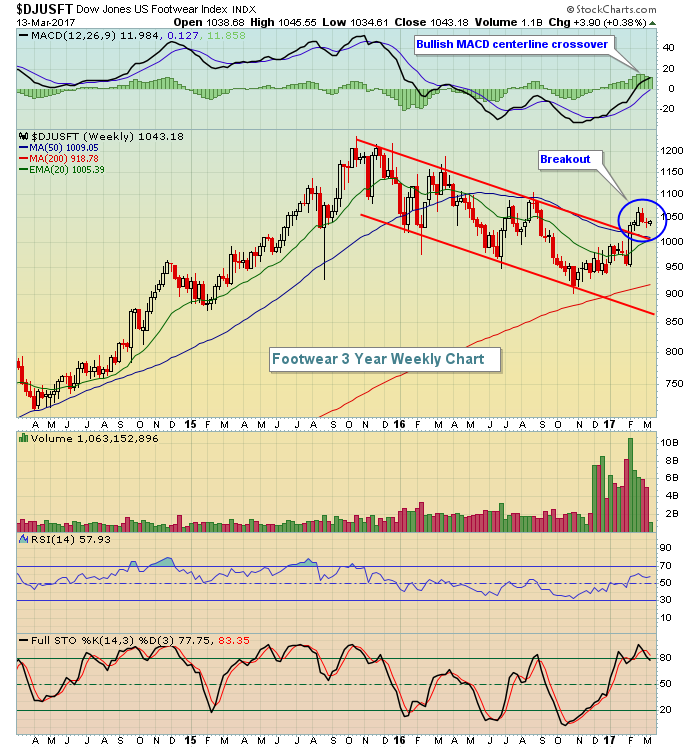 I'm looking for this uptrend to extend for quite some time. Note that the rising 20 week EMA is approaching a key golden cross (rise above 50 week SMA). I'd use that rising 20 week EMA as my long-term support level and closing stop (so that means a Friday close since we're looking at weekly candles). Check out the Historical Tendencies section for a footwear stock that absolutely LOVES the months of March and April.
Historical Tendencies
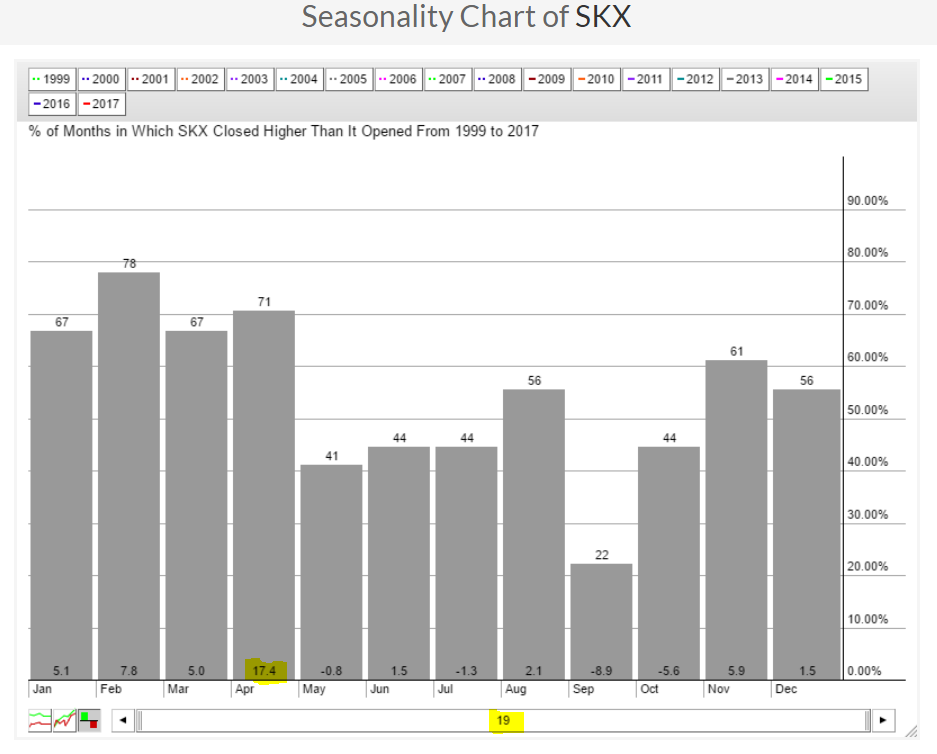
The DJUSFT performs best in the last four months of year when Nike (NKE) tends to shine. But Skechers (SKX) performs exceptionally well during the first four months of the year and technical conditions are aligning bullishly for SKX as it approaches its absolute best seasonal period of the year - April. SKX has averaged gaining 17.4% gains during the month of April over the last 19 years. That's simply remarkable. The DJUSFT averages gaining 1.7% during April so the relative outperformance of SKX is quite clear. Here's the seasonal history for SKX by calendar month:
 Technical conditions have improved greatly in recent weeks for SKX and now we're approaching the stock's absolute best month. Check out the current technical indications:
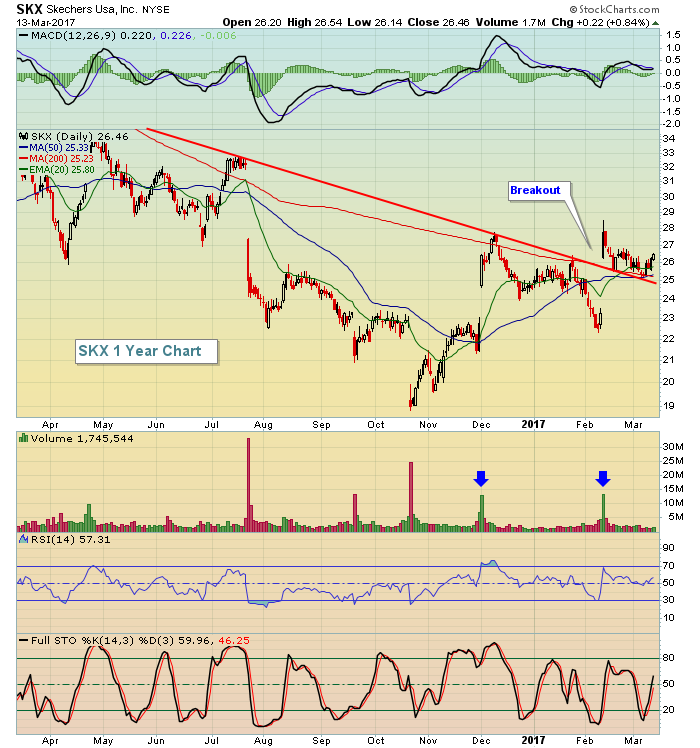 Let me be clear about one thing. Nike (NKE) is currently testing its rising 20 day EMA and is the safer play in this industry. But SKX clearly has been the better performer during this time of the calendar year and is also setting up bullishly. So if you decide to trade the footwear space, the question becomes....are you willing to take on the additional risk of trading SKX? Keep in mind that SKX fell from 55 to under 20 during a one year downtrend. Therefore, be sure to keep stops in place.
Key Earnings Reports
(actual vs. estimate):
HDS: .44 vs .44
Key Economic Reports
February PPI released at 8:30am EST: (actual) vs. +0.1% (estimate)
February Core PPI released at 8:30am EST: (actual) vs. +0.2% (estimate)
Happy trading!
Tom
