Market Recap for Tuesday, April 11, 2017
The Volatility Index ($VIX) hit its lowest level since mid-November on Tuesday, nearly reaching 16 before backing off and closing at 15.07 and up 7.26% on the session. That development is significant because the S&P 500 has remained above its recent price support, yet more and more fear is being priced into the market. The following chart shows this visually:
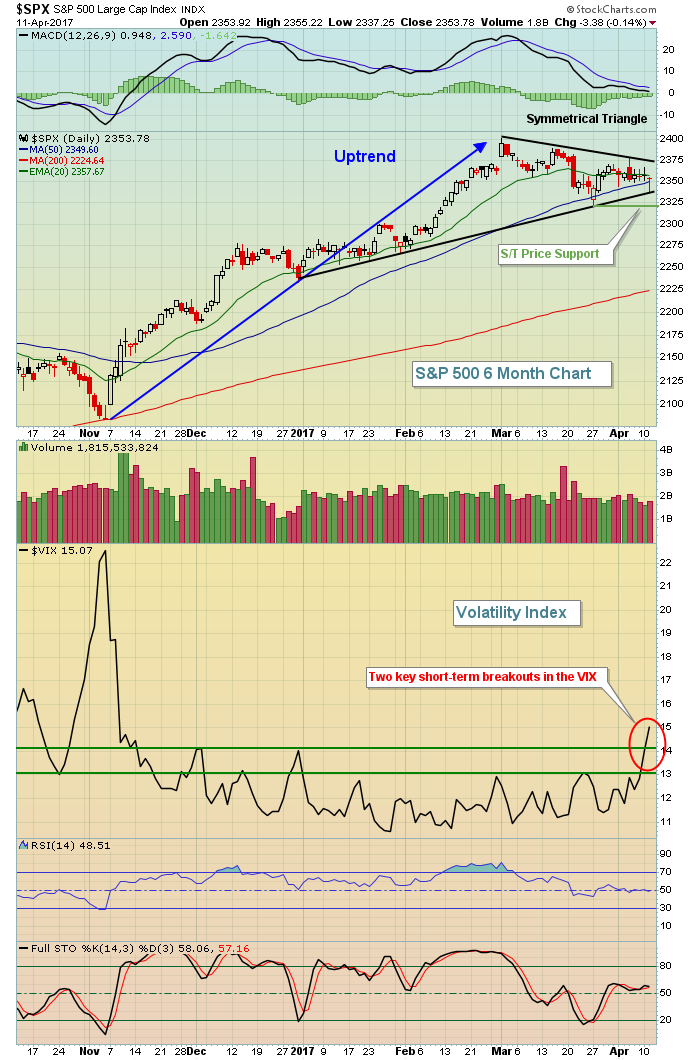 The March 27th price low on the S&P 500 remains close to 1.5% away, yet in the past two days we've seen the VIX, or "fear meter", rise beyond short-term resistance of 13, then intermediate-term resistance of 14. While this does not guarantee us of trouble on the horizon, it tells me that the U.S. stock market is not in great shape to handle bad news. Just a few days ago, we saw the market's resiliency in handling a surprisingly awful jobs report. As the VIX rises, it becomes less likely that traders will ignore than type of bad news.
Industrials (XLI, 0.14%) did manage to recover and finish with a gain on Tuesday, led by airlines ($DJUSAR) and defense ($DJUSDN). Defense has performed very well since the Syrian missile strikes and rising geopolitical concerns. Technology (XLK, -0.38%) and financials (XLF, -0.30%) were the two weakest groups on Tuesday, although the XLK did touch its 50 day SMA after printing a negative divergence recently. Check it out:
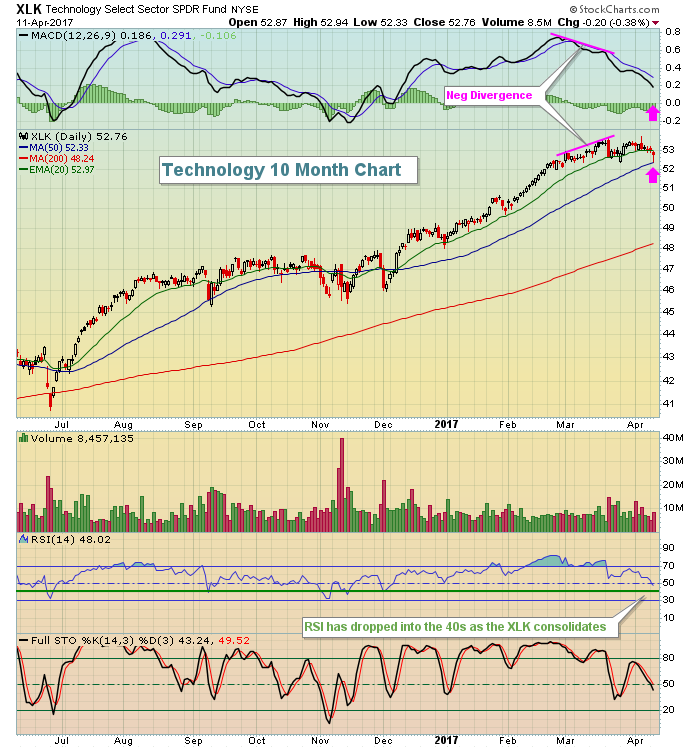 Technology stocks were very overbought back in February with an RSI in the 80s, but a negative divergence emerged on that mid-March high and we've seen weakness since as the RSI has now fallen back into the 40s. The pink arrows highlight a possible upcoming MACD centerline test and the 50 day SMA test that we saw yesterday.
Pre-Market Action
It's been a very quiet week thus far in terms of economic reports, but we'll see that change tomorrow and Friday. These reports will be significant as the 10 year treasury yield ($TNX) has fallen again and now resides almost squarely on support - intraday support is 2.27% and closing support is 2.30%. At last check, the TNX was at 2.29%. The significance is that banks ($DJUSBK) and life insurance companies ($DJUSIL) perform very well in a rising interest rate environment. As a result of the rising TNX, financials (XLF, +20.67%) have easily been the best performing sector. There's a potential topping head & shoulders pattern in play, however, on the XLF that bears watching. Check it out:
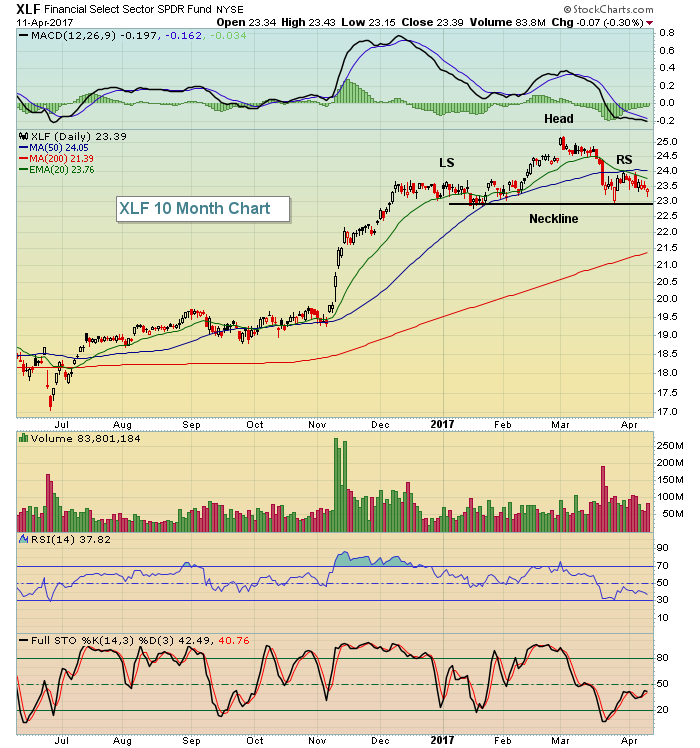 Watch the 22.80-22.90 support area. A confirmed heavy volume close beneath this range will likely make banks and life insurance companies much more vulnerable to technical selling.
Crude oil ($WTIC) continues its climb this morning to 53.64 per barrel as energy looks to continue its recent leadership.
Dow Jones futures are down 12 points with 30 minutes left to the opening bell following mixed action in Asian and European markets.
Current Outlook
In the Market Recap section above, there's a chart that features the short-term rise in the VIX and a key short-term price support level at 2320 or so. The following weekly chart is a bigger picture view of the S&P 500:
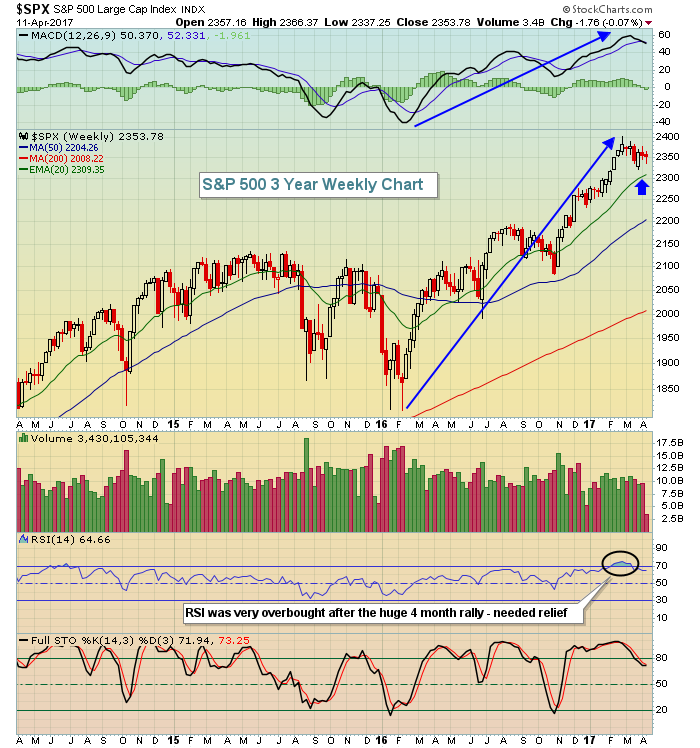 The MACD showed strong momentum on the recent price high and when that's the case, I look for rising 20 period EMA support to hold. The blue arrow marks that EMA, which currently stands at 2309. So short-term price support resides near 2320 and this rising 20 week EMA is at 2309. That's the current range of support in my view.
Sector/Industry Watch
Gold ($GOLD) has been a big beneficiary of heightened geopolitical concerns and a rising VIX. As a result, we've seen gold clear cup with handle resistance, measuring to the 1330-1340 range. Here's the current short-term view of gold:
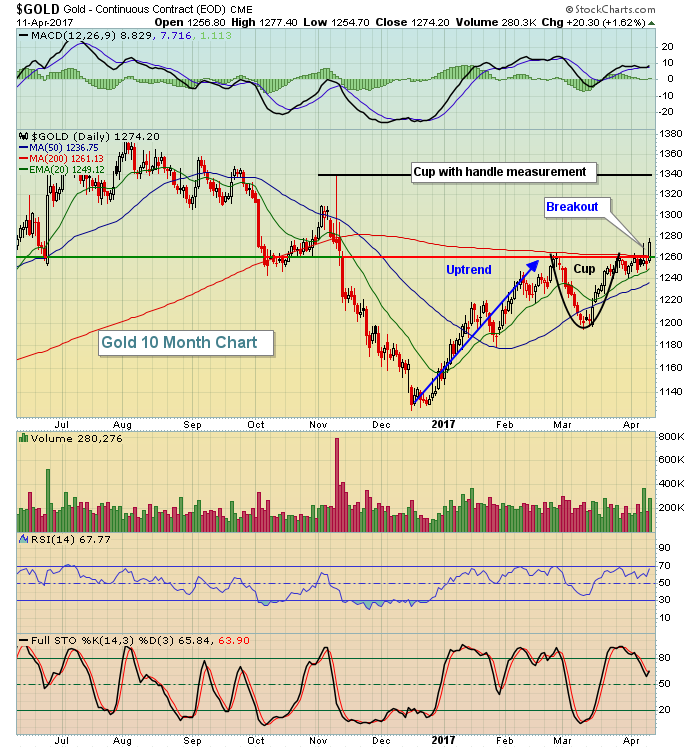 The measurement is determined by the distance between the top and bottom of the cup, which is roughly 1265 down to 1195, or 70 points. Then you take the breakout level of 1265 and add 70 points. That result of 1335 is where I'd expect gold to climb to based on this pattern. That's very close to the key price resistance of 1340 established at the time of the November election. To the downside, losing both price support at 1265 and the rising 20 day EMA, currently at 1249, would negate this pattern in my view.
Historical Tendencies
Wednesdays through Fridays have historically provided excellent returns on the S&P 500 since 1950. This three day period that falls between the 11th and 18th tends to be particularly strong. We'll see if that holds true this week with the rising VIX showing that the market is growing more cautious.
Key Earnings Reports
(actual vs. estimate):
DAL: .77 vs .73
FAST: .46 vs .46
SJR: .23 vs .23
(reports after close, estimate provided):
INFY: .24
Key Economic Reports
None
Happy trading!
Tom
