Market Recap for Friday, May 12, 2017
The NASDAQ finished higher on Friday, but that was not the case for the Dow Jones and S&P 500, which both finished fractionally lower. The Russell 2000 was hit hardest as this small cap index again threatened a short-term breakdown beneath 1380. It managed to hold that intraday support level, but did close at its lowest level in nearly four weeks. The Russell 2000's relative strength in April vs. the benchmark S&P 500 has completely vanished and we've been seeing a lot of relative weakness in May. So while the Russell 2000 attempts to hold onto its 1380 price support, it also needs to outperform the S&P 500 to hold onto the relative support established in the latter part of March, as highlighted below:
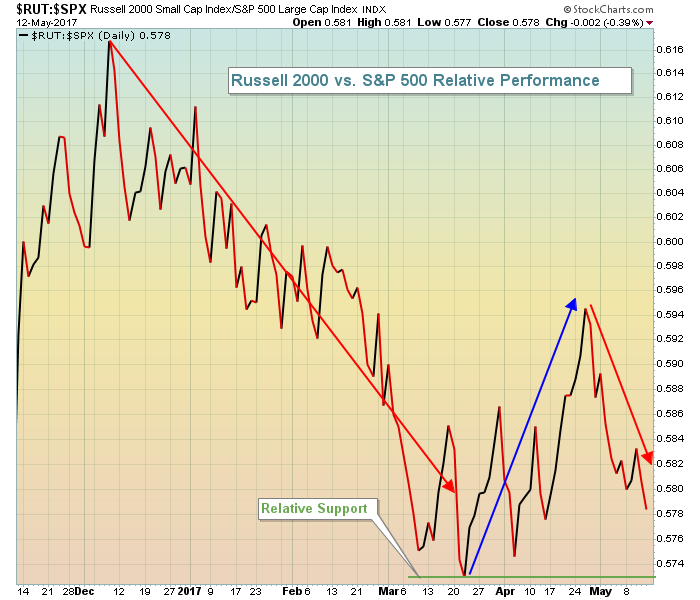 The five week period of relative strength has come to a screeching halt and now the small cap bulls need to stem the tide of relative weakness. Watch the relative support line at roughly .573. A breakdown there would suggest that traders remain at least somewhat cautious, favoring the more stable S&P 500.
Utilities (XLU, +0.49%) led the sector action on Friday as the XLU continues to successfully defend its very narrow trading range from 51.00-52.00 as you can see below:
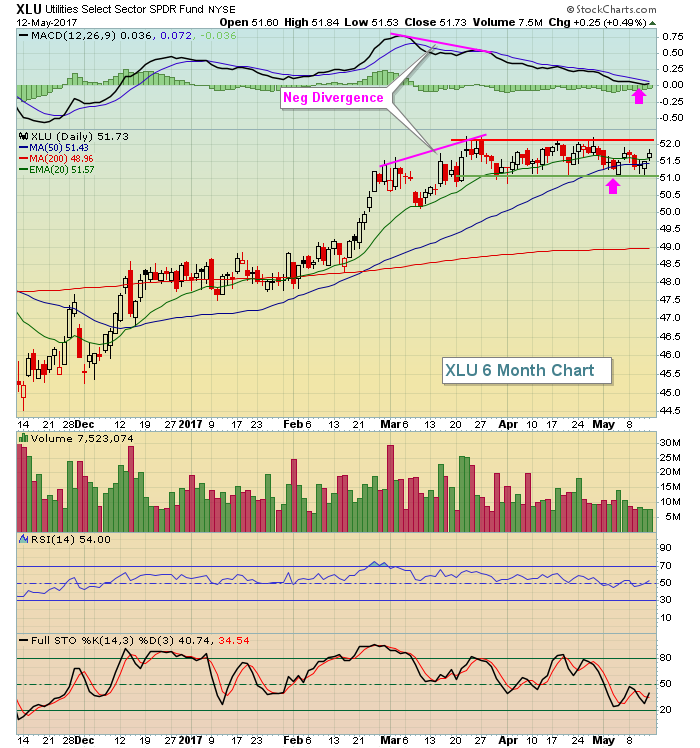 The XLU has struggled since printing that negative divergence in March. The two pink arrows show that consolidation has taken the MACD back to its centerline for a "reset", while there's also been a 50 day SMA test. Now we're simply waiting to see which way this trading range breaks.
Industrials (XLI, -0.55%) were the worst performing sector on Friday, but it's understandable given its current pattern. For more, see the Sector/Industry Watch section below.
Pre-Market Action
Dow Jones futures are up 43 points to start a fresh trading week. Technically and historically, the U.S. indices are poised for further strength this week and the pre-market is underscoring this. The U.S. market will be opening in 30 minutes amid mixed global action. There's a very slight move higher in the 10 year treasury yield ($TNX) this morning despite a weak empire state manufacturing survey.
Crude oil prices ($WTIC) are up more than 3% this morning as both the Saudis and Russia support a longer-term supply cut. Expect energy (XLE) to lead today based on this development.
Cyber security stocks should be in focus today as well as the "WannaCry" malware spreads throughout the world and potentially impacts businesses.
Current Outlook
The NASDAQ has been the clear, undisputed leader among major U.S. indices in 2017. Recently, it faced the challenge of negative divergences on its hourly chart, but that's not an issue right now so I'm looking for further absolute and relative strength from this tech-laden index as we move forward. Here is the current technical picture on a 60 minute chart:
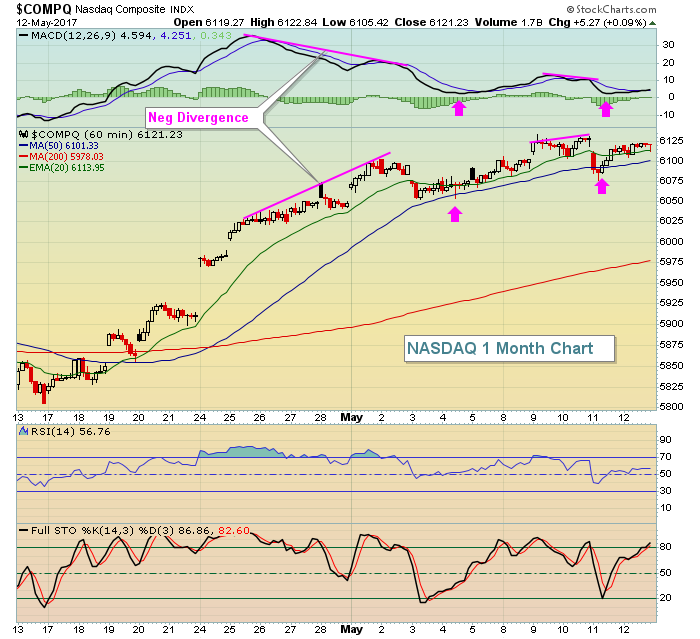 The pink arrows above illustrate the MACD centerline resets and 50 hour SMA tests that I look for after negative divergences emerge. Traders will be looking for more relative strength from the NASDAQ in the days and weeks ahead.
Sector/Industry Watch
The industrial stocks (XLI) fell on Friday, but appear to be in a very bullish cup with handle formation that I'd expect to break to the upside in time. Here's the visual:
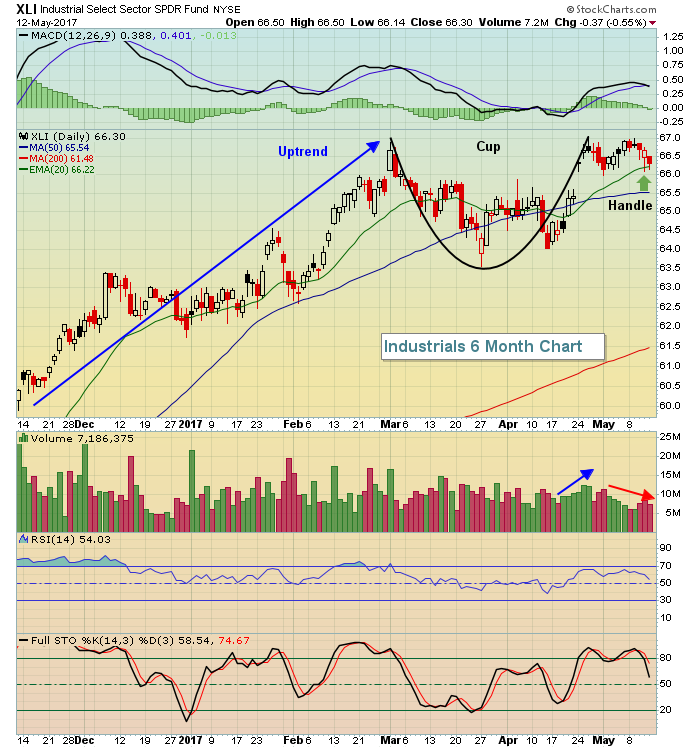 In my view, this is a classic cup with handle pattern. First, we have an uptrend, which is paramount to later establish a continuation pattern. Why? Because you have to have a prior uptrend to "continue". Second, check out the volume bars - rising volume to establish the right side of the cup, followed by declining volume as the handle forms. Third, note that the handle has fallen back to test the rising 20 day EMA (green arrow), another key support level when momentum (MACD) is accelerating. Now, we simply await the breakout. The measurement would be 70.50 on a breakout, which would be roughly 6-7% higher from the XLI's current price.
Monday Setups
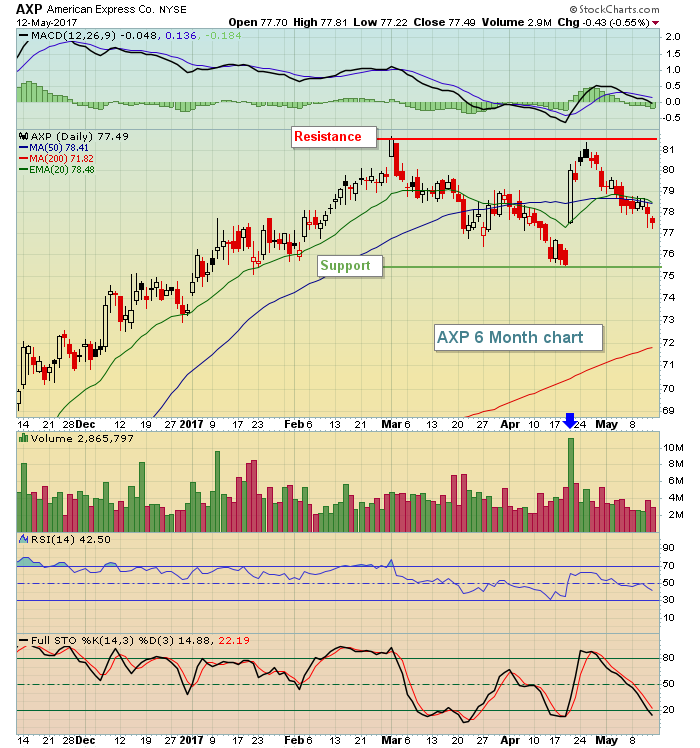
American Express (AXP) looks very interesting at the current level. It's currently trading at the top of gap support from April 20th after AXP released its latest quarterly results, which were very strong. The bottom of gap support resides near 75.50. I favor entry into AXP from its current price down to 75.50 with a tight closing stop beneath 75.00. The short-term target would be the high from March 1st near 81.50. I expect we'll see another breakout, but testing that price resistance would be a solid short-term profit. Here's the chart to illustrate:
 I'll be discussing this AXP setup in addition to others in the MarketWatchers LIVE show that begins later today at noon EST. The setups will be featured in the first 15-20 minutes of the show. At noon EST, simply CLICK HERE to join the show live.
Historical Tendencies
Money flows typically dictate bullish action this time of a calendar month. Below are the NASDAQ's annualized returns of every day from the 15th through the 18th (not just from May, but from all calendar months):
15th: -4.23%
16th: +39.22%
17th: +10.61%
18th: +21.21%
This data represents the cumulative action on these four calendar days since 1971.
Key Earnings Reports
(reports after close, estimate provided):
VIPS: .16
Key Economic Reports
May empire state manufacturing survey released at 8:30am EST: -1.0 (actual) vs +8.0 (estimate)
May housing market index to be released at 10:00am EST: 68 (estimate)
Happy trading!
Tom
