Market Recap for Tuesday, May 30, 2017
Technology (XLK, +0.43%) remains the heart of this current bull market. The XLK was the sector leader on Tuesday, with utilities (XLU, +0.32%) a close second. Over the past week, utilities and consumer discretionary (XLY) hold a slight edge over technology. However, technology is the best performing sector over the past month, three month, six month and year periods. They simply have not relinquished the top spot among sectors as traders continue to find reasons to buy component stocks. Rotation has been key. As an example, the Dow Jones U.S. Mobile Telecommunications Index ($DJUSWC) is higher by an astounding 44.85% over the past year, but the DJUSWC has been a laggard the past month (-1.37%) as telecommunications stocks have taken a back seat to all other technology industry groups. While the one month leader has been electronic office equipment, this strength is mostly due to a bounce in Pitney Bowes (PBI) as the index tracks PBI very closely. The second best industry group has been semiconductors ($DJUSSC) as you can see below:
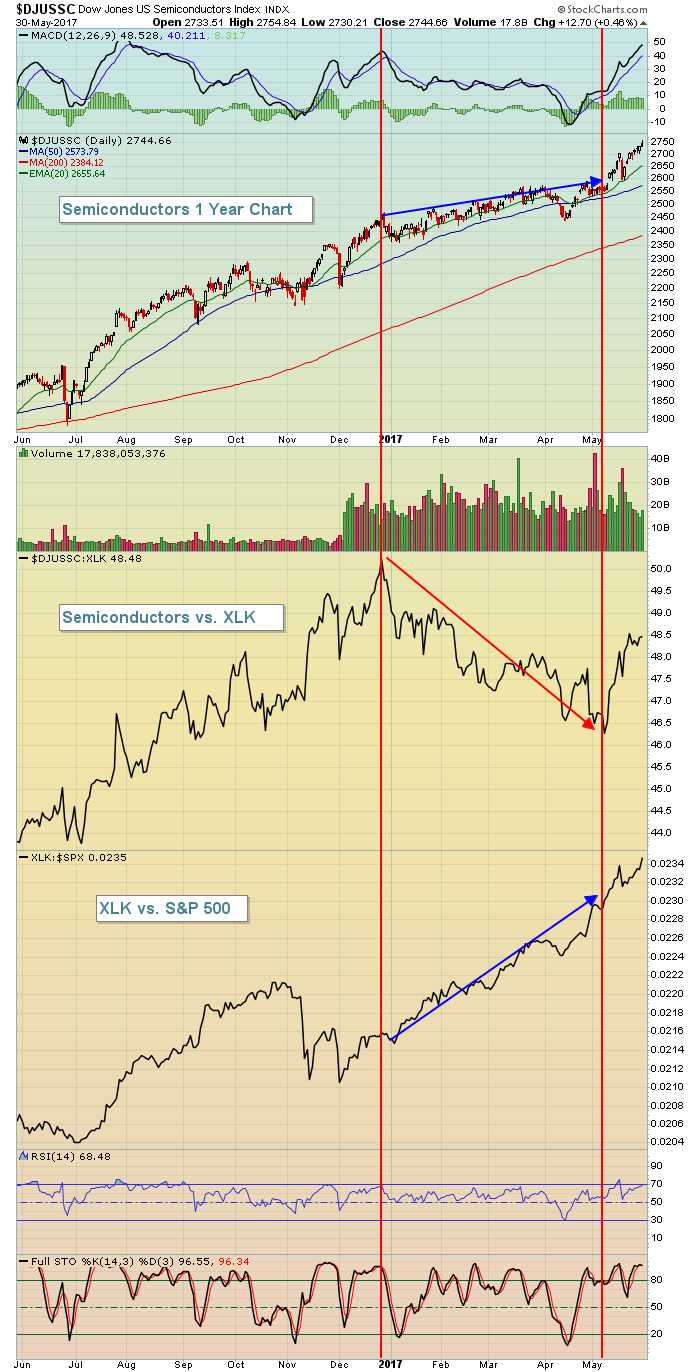 This should help to illustrate a couple points. First, it's rather clear from the top chart that the absolute performance of semiconductors has been strong as the uptrend has been intact throughout the last year. But the highlighted five month period where the DJUSSC was underperforming the XLK, note that the absolute performance of the DJUSSC was still rising. It didn't go down, it simply underperformed its peers - allowing other technology industry groups to lead for awhile. The bottom price relative chart (XLK:$SPX) shows that technology never gave up its leadership role, despite the baton being passed from the DJUSSC to other technology groups. Over the past several weeks, you can see not only continuing absolute strength in the DJUSSC, but also the return of relative strength.
On the flip side yesterday, energy (XLE, -1.34%) tumbled as pipelines ($DJUSPL) closed at its lowest level since August 2016. The 10 year treasury yield ($TNX) also fell a few basis points, putting pressure on financials (XLF, -0.68%), especially banks ($DJUSBK) which fell over 1% and moved closer and closer to its critical price and neckline support near 385. The DJUSBK closed at 394.58.
Pre-Market Action
The 10 year treasury yield ($TNX) is flat thus far this morning as traders await the release of the beige book at 2pm EST this afternoon. Oil prices are again taking a hit with crude down more than 2% this morning.
Dow Jones futures are up 38 points with 30 minutes remaining to the opening bell.
Current Outlook
Banks ($DJUSBK) remain a very critical piece of the bullish puzzle. We do not want to see banks break down as that would signal a potential breakdown in the 10 year treasury yield ($TNX). In turn, that would suggest that bond traders do not see the economic improvement ahead that the Fed has been discussing for months. Once banks begin to underperform, they tend to grow more conservative and that can affect credit availability for businesses, adding to potential economic weakness. As a reminder, here is the potential topping head & shoulders pattern to watch on the DJUSBK:
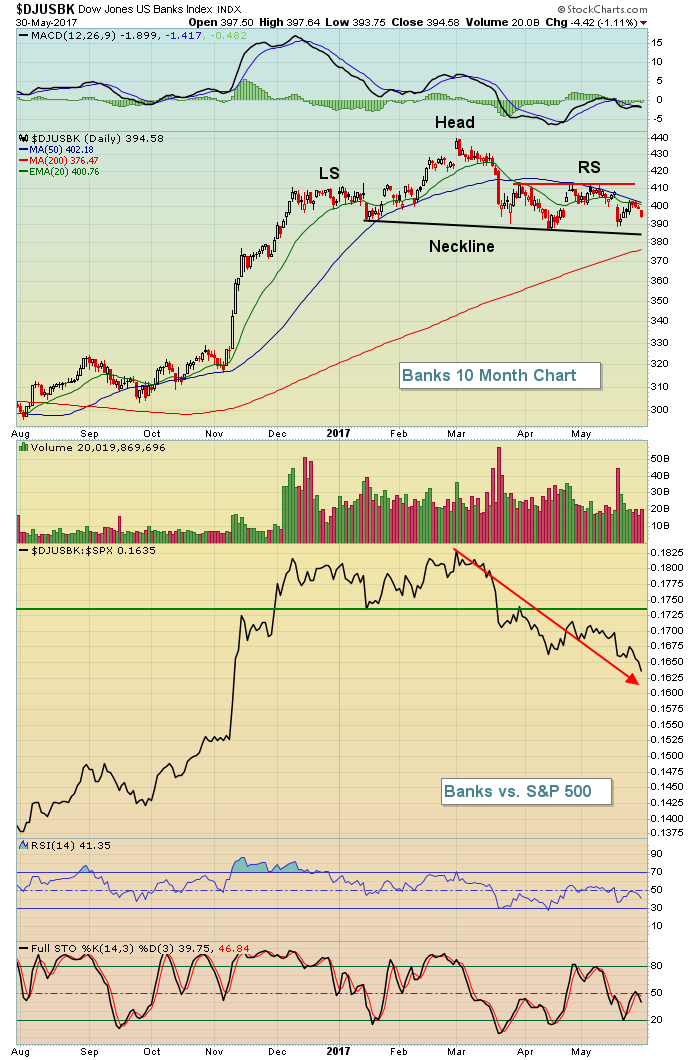 The current trading range is from 385-410, but it's easy to see the relative weakness in banks right now. Losing price and neckline support given the weakening relative performance would be a serious blow to the bulls. Keep an eye on banks.
Sector/Industry Watch
Internet ($DJUSNS) and software ($DJUSSW) have both been performing quite well, so let's take a look at these two industry groups visually:
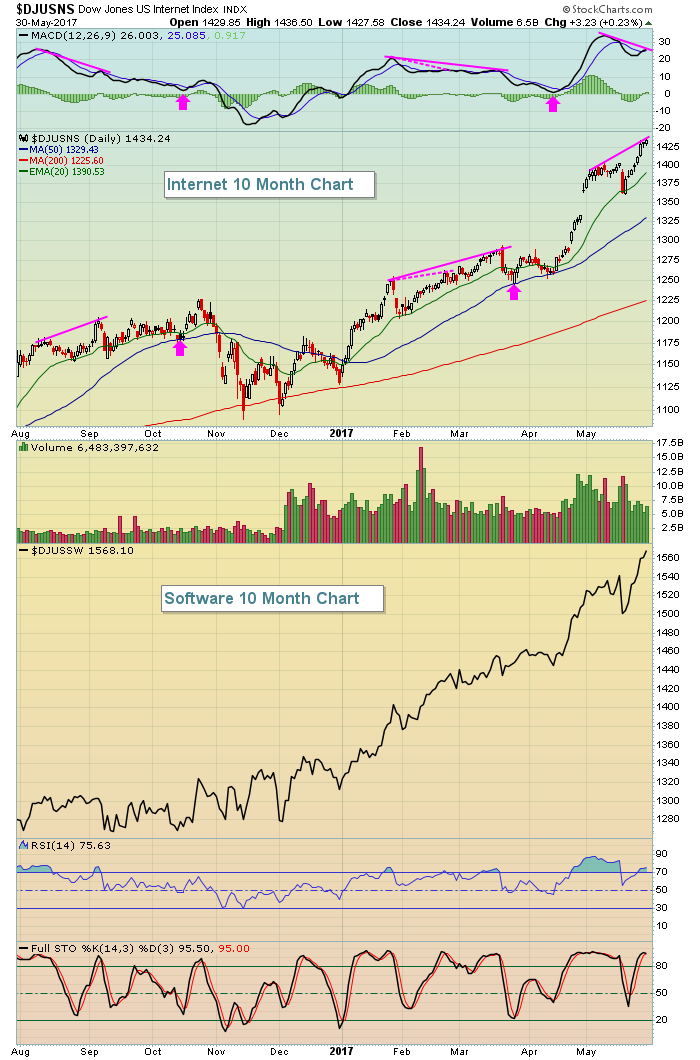 The DJUSSW also has a negative divergence similar to the ones appearing on the DJUSNS (pink lines). Note the pink dotted lines in February. Prices are higher, the MACD is lower. However, the DJUSNS rose another 3% or so before selling kicked in. These negative divergences are warning us that momentum is slowing, but it doesn't mean we'll see immediate selling. The pink arrows above do show us that prior negative divergences did eventually result in weakness for at least a period of time to unwind those negative divergences with MACD centerline tests/50 day SMA tests.
Historical Tendencies
Beginning May 26th, and running through June 5th, the Russell 2000 (since 1987) has produced annualized returns of 64.59%. At the close on May 25, 2017 (last Thursday), the Russell 2000 ($RUT) was at 1383.39. Thus far, during this bullish historical period, the RUT is down nearly 1%. Here are the annualized returns for each of the calendar days that make up the balance of this bullish period:
May 31 (today): +91.20%
June 1 (Thursday): +77.08%
June 2 (Friday): +129.53%
June 5 (Monday): +66.49%
Key Earnings Reports
(actual vs. estimate):
ADI: 1.03 vs .85
KORS: .73 vs .70
(reports after close, estimate provided):
HPE: .35
Key Economic Reports
May Chicago PMI to be released at 9:45am EST: 57.5 (estimate)
April pending home sales to be released at 10:00am EST: +0.5%
Beige book to be released at 2:00pm EST
Happy trading!
Tom
