Market Recap for Monday, May 8, 2017
The small cap Russell 2000 lagged on Monday with the other major indices tacking on minor gains. Energy (XLE, +0.71%) was the leader with coal ($DJUSCL) jumping 3.50%. The DJUSCL, however, is hitting major trendline resistance after kick-saving at price support. Take a look at the chart:
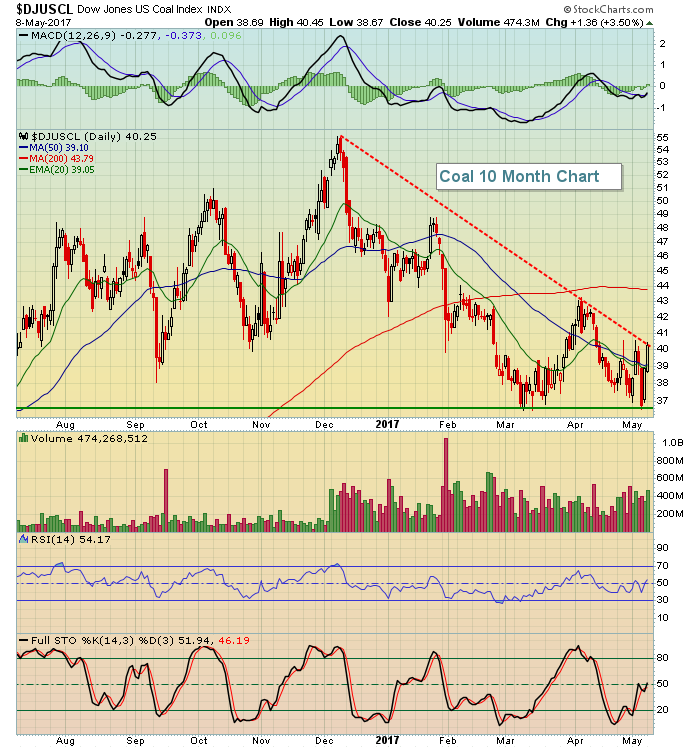 So while Monday's gains were nice, there's much work to do here technically.
Materials (XLB, -.80%) and healthcare (XLV, -0.62%) were the two laggards on Monday. Commodity chemicals ($DJUSCC) were down 1.19%, taking a toll on the materials sector. The good news, however, is that the DJUSCC remains in a very bullish pattern and yesterday's weakness simply fits into a pattern of bullish consolidation. Healthcare was hampered by a weak biotech group ($DJUSBT). Biotechs fell 1.63% and continue to barely hang onto rising 20 week EMA support. Biotechs are the aggressive part of healthcare so leadership from this group would be welcome by the bulls.
Pre-Market Action
The 10 year treasury yield ($TNX) has climbed back above 2.40% and Dow Jones futures are up more than 30 points as we approach the opening bell.
European markets are mostly higher, aiding the pre-market action here in the U.S.
Current Outlook
During bull markets, I like to see aggressive areas of the market outperform their defensive counterparts. Two sectors that I watch very carefully are consumer discretionary (XLY) and consumer staples (XLP) and the relative strength of one vs. the other (XLY:XLP). Another key relative ratio is the more aggressive small cap Russell 2000 index ($RUT) vs. the benchmark S&P 500 ($SPX). This ratio ($RUT:$SPX) should be rising to support the theory that traders have a healthy appetite for risk. Here are both ratios, compared to absolute performance of the S&P 500:
 While the S&P 500 has just closed at an all-time high, there remains a bit of price resistance in the 2400 area, along with the psychological resistance of another round number. The XLY:XLP ratio supports higher prices while the Russell 2000 has been struggling on a relative basis in May after a very strong April. The bulls would be best served by another small cap rally.
Sector/Industry Watch
Truckers ($DJUSTK) have just broken down on their daily chart. While that is a short-term negative for sure, it's actually setting up the group bullishly from a longer-term perspective. Here's what both timeframes look like:
Short-term:
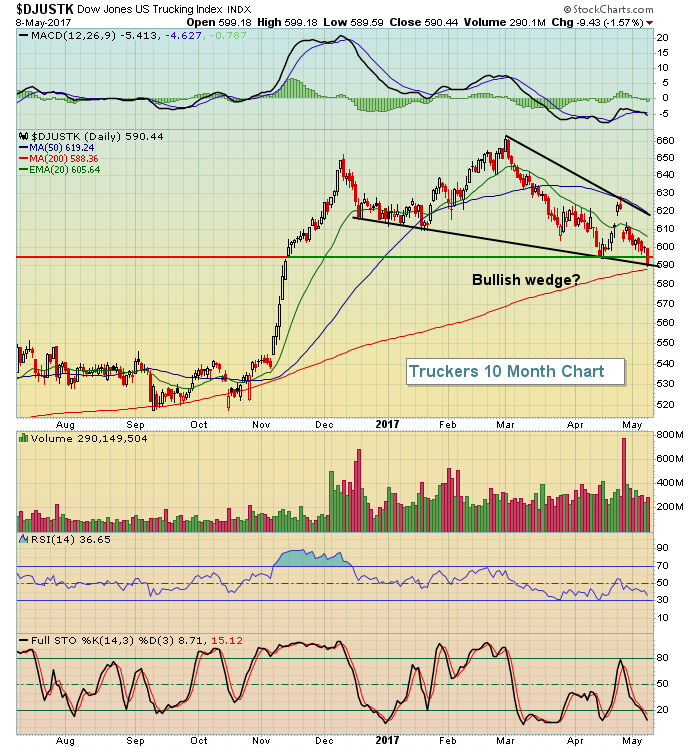 The short-term price support near 595, established with the April price low, was eclipsed on Monday and that could lead to further short-term selling. There is one bullish argument here in that the weakness is a form of consolidation in a very bullish wedge.
Now for the longer-term look at truckers:
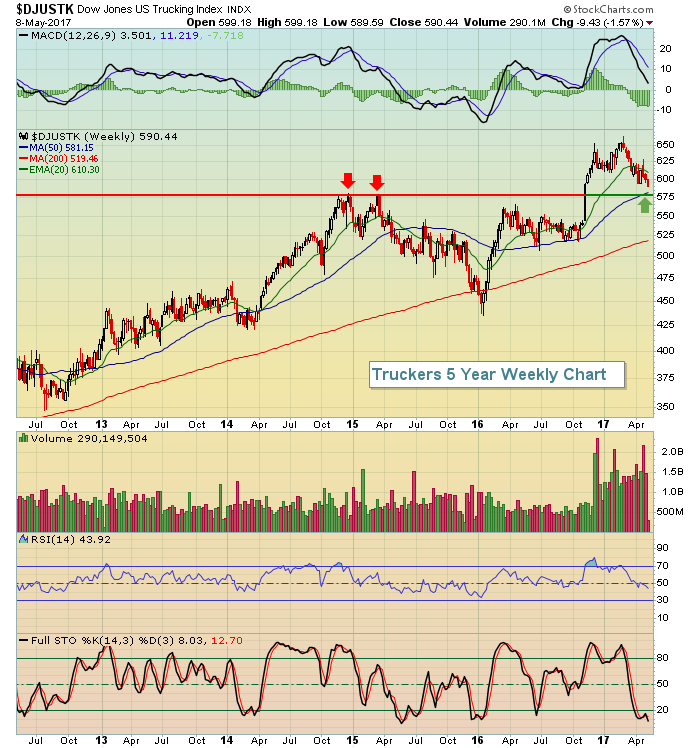 The longer-term weekly chart puts everything in perspective. While the short-term chart showed that prices continued moving lower with a break of recent price support, the longer-term weekly chart shows that very strong support can be found from 575 (price support) to 581 (50 week SMA), providing a very strong reward to risk entry into the group as that range is tested.
Historical Tendencies
The U.S. stock market remains quite bullish technically in my view, but the bulls may need to get all they can get prior to June. Why? Because June is the only month where we see underperformance vs. the benchmark S&P 500 in three of the four aggressive sectors. Here's an Excel spreadsheet repost from an early January article that I wrote detailing sector relative performance:
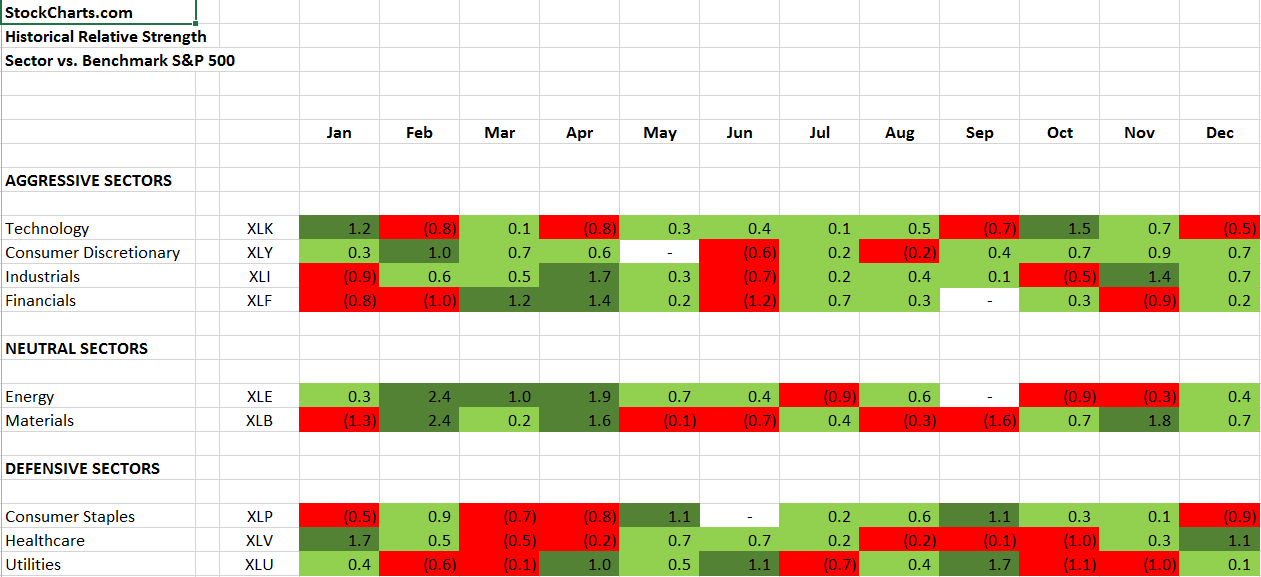 If you look above at the aggressive sector performance during June, you'll see three numbers highlighted in red. These are not actual average returns for each sector. Instead, they are average relative performance numbers. For example, the (0.6) listed next to consumer discretionary (XLY) means that over the past two decades, the XLY has underperformed the S&P 500 by an average of 0.6%. The fact that three out of four aggressive sectors averages underperforming the benchmark S&P 500 tells us that the bears typically have the upper hand during that calendar month. So.......the bulls will be looking to capture profits during May rallies.
Key Earnings Reports
(actual vs. estimate):
AGN: 3.35 vs 3.32
AON: 1.45 vs 1.28
DUK: 1.04 vs 1.05
XRAY: .49 vs .51
(reports after close, estimate provided):
DIS: 1.45
EA: .61
MCHP: .99
NVDA: .66
PCLN: 8.80
SLF: .75
Key Economic Reports
March wholesale trade to be released at 10:00am EST: +0.2% (estimate)
Happy trading!
Tom
