Market Recap for Tuesday, June 20, 2017
Healthcare (XLV, +0.33%) was one of just two sectors - utilities (XLU, +0.06%) was the other - to rise on Tuesday as much of Monday's gains was relinquished. The good news, however, is that biotechs ($DJUSBT) made a significant breakout on Tuesday and that bodes well for the group over the next couple months. History won't hurt the group either - check out the Historical Tendencies section below. Here's a five year weekly chart showing the significance of this move above 1800:
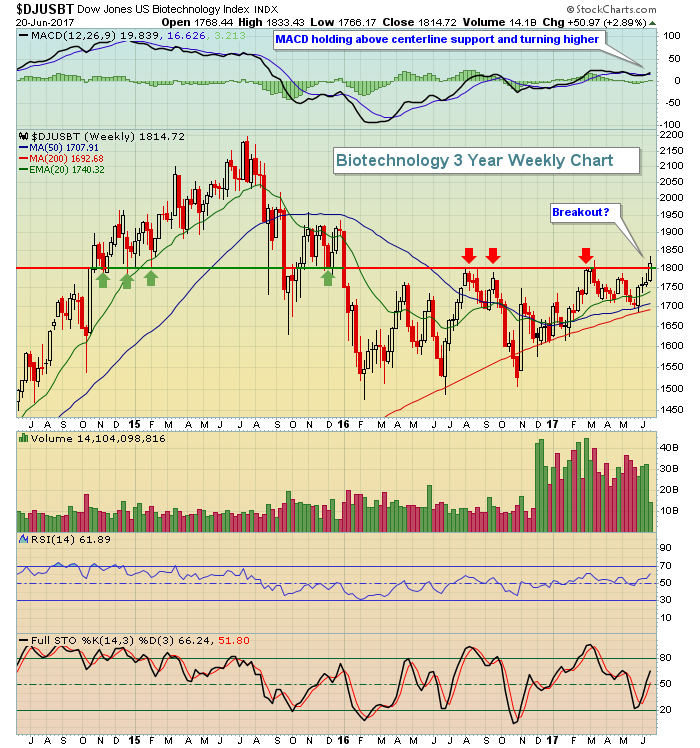 1800 has been a very significant pivot level for biotechs the past couple years so don't underestimate the significance of the breakout above. The one issue technically is that this breakout is "intraweek" and these are weekly candles. Therefore, we need to see this breakout hold into Friday's close in order to confirm the signal. Volume is already moderate and should be watched into week's end as well. Volume over 35-40 billion and a confirmed weekly close above 1800 will likely send more buyers into this group next week.
While healthcare and utilities were strong on a relative basis Tuesday, energy (XLE, -1.28%) was very weak with crude oil falling to $43 per barrel. This is a key support level that needs to hold or we'll likely continue the drop to $39 per barrel.
Pre-Market Action
We're seeing mostly global weakness this morning as the world reacts to more selling in technology shares in the U.S. and falling crude oil prices. With little on tap in terms of economic news, technical factors will remain in focus. With 30 minutes left to the opening bell, Dow Jones futures are flat.
Current Outlook
The relationship between the S&P 500 and 10 year treasury yield ($TNX) tends to be one of short-term positive correlation. As money rotates out of treasuries, the corresponding treasury yields rise - always. Money rotating away from defensive treasuries tends to find a home in the more aggressive equities with a corresponding rise in the S&P 500 ($SPX). Therefore, the TNX and SPX typically will show positive correlation (readings above 0). When we see negative correlation (readings below 0), that negative correlation is generally resolved fairly quickly. Currently, there's a huge disparity and negative correlation between the two. That's likely to result in a "catch up" where either we see U.S. equities decline.....or treasuries begin to sell off with rising yields. Here's the chart showing the difference:
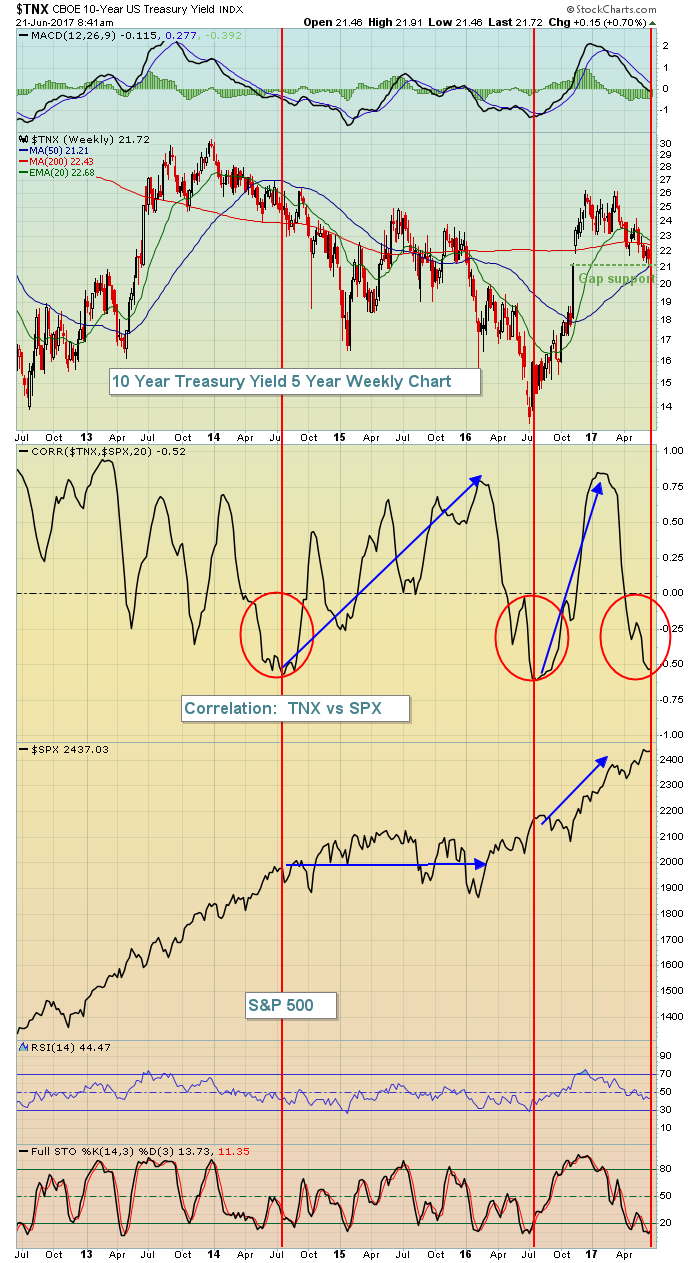 The red circles highlight the last two times we've seen negative correlation between the TNX and SPX similar to what we're seeing today. The initial negative correlation resulted in the S&P 500 trading mostly sideways for the next 18 months to move the TNX:SPX correlation factor back in sync and in positive territory. The second negative correlation occurred in mid-2016 and the result was quite different - a huge advance in the S&P 500 to once again see correlation move back into positive territory. Now we have a third negative correlation and I fully expect we'll begin to move back into positive correlation over the next 3-6 months. The question is, however, will that happen because equities move lower or sideways.....or will we begin to see the TNX rising again as money rotates to fuel the next equity rise? I tend to lean towards the latter because the technical picture on the aggressive U.S. sectors remains strong. We do need to at least recognize the current disparity between the TNX and SPX, though, and understand we're very likely to see "catch up" in one direction or the other.
Sector/Industry Watch
The Dow Jones U.S. Software Index ($DJUSSW) will be one to watch after the closing bell today. Oracle Corp (ORCL) reports its latest results and appears to be trading as though solid results are awaiting. After its last quarterly report in March, ORCL gapped higher and it's continued to hold those gains as it's traded in a bullish rectangular consolidation pattern. The stock has also seen strength in recent days on increasing volume as accumulation appears to be taking place prior to the report tonight. Here's the chart of ORCL and its recent relative breakout:
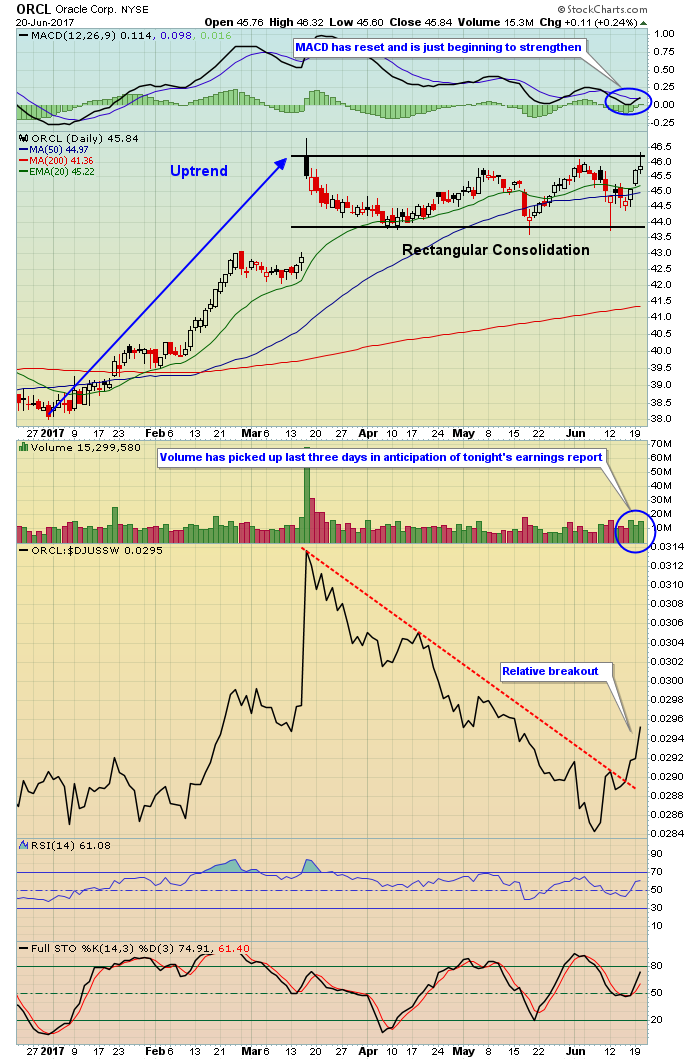 ORCL has been performing very well vs. its software peers the past couple weeks and I'm expecting to see a very solid earnings report tonight. I don't like the risks involved with holding stocks into earnings, but I would not be surprised by better than expected top and bottom lines when ORCL reports after today's closing bell.
Historical Tendencies
The breakout yesterday in the Dow Jones U.S. Biotechnology Index ($DJUSBT) is more significant given the strength that biotechs tend to display over the summer months. Below is the average return of the DJUSBT by calendar month over the past 20 years:
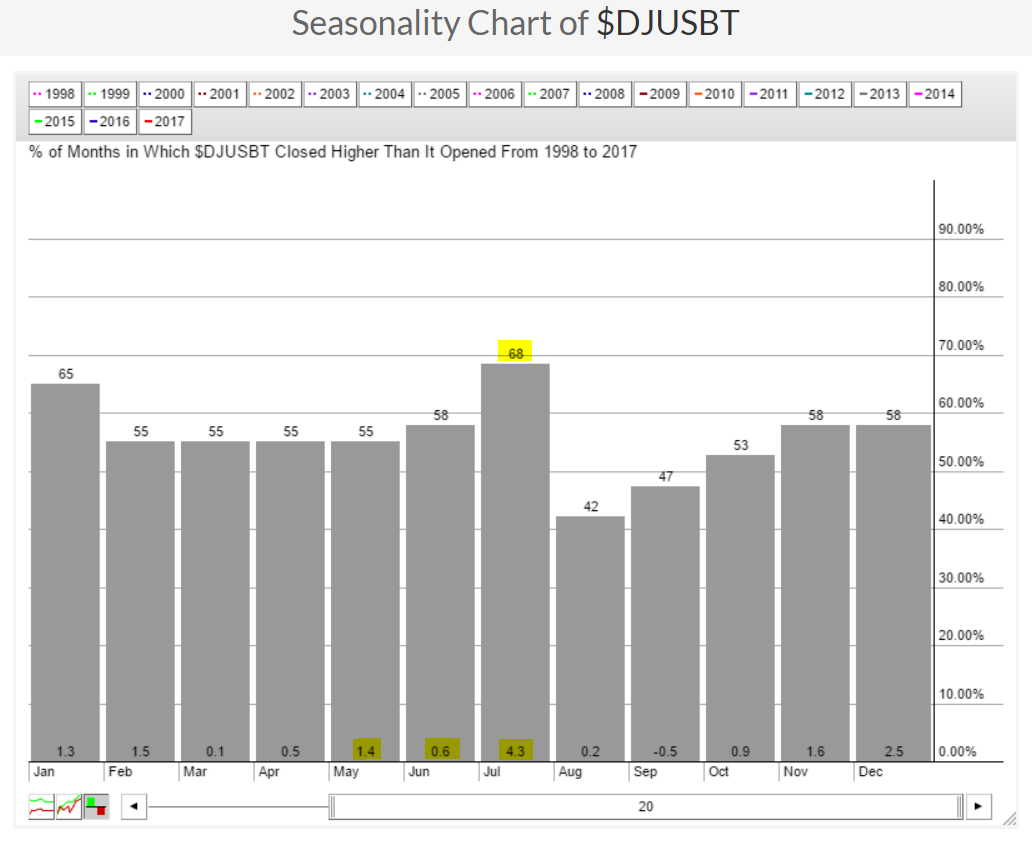 The May through July period has been the group's best three month period if we look back over the past two decades. July, in particular, has been extremely bullish and that's a great sign on the heels of Tuesday's breakout.
Key Earnings Reports
(reports after close, estimate provided):
ORCL: .73
Key Economic Reports
May existing home sales to be released at 10:00am EST: 5,550,000 (estimate)
Happy trading!
Tom
