Market Recap for Friday, June 9, 2017
They say a picture can say a thousand words so before I further discuss the carnage from Friday, take a look at this performance chart of NASDAQ 100 components:
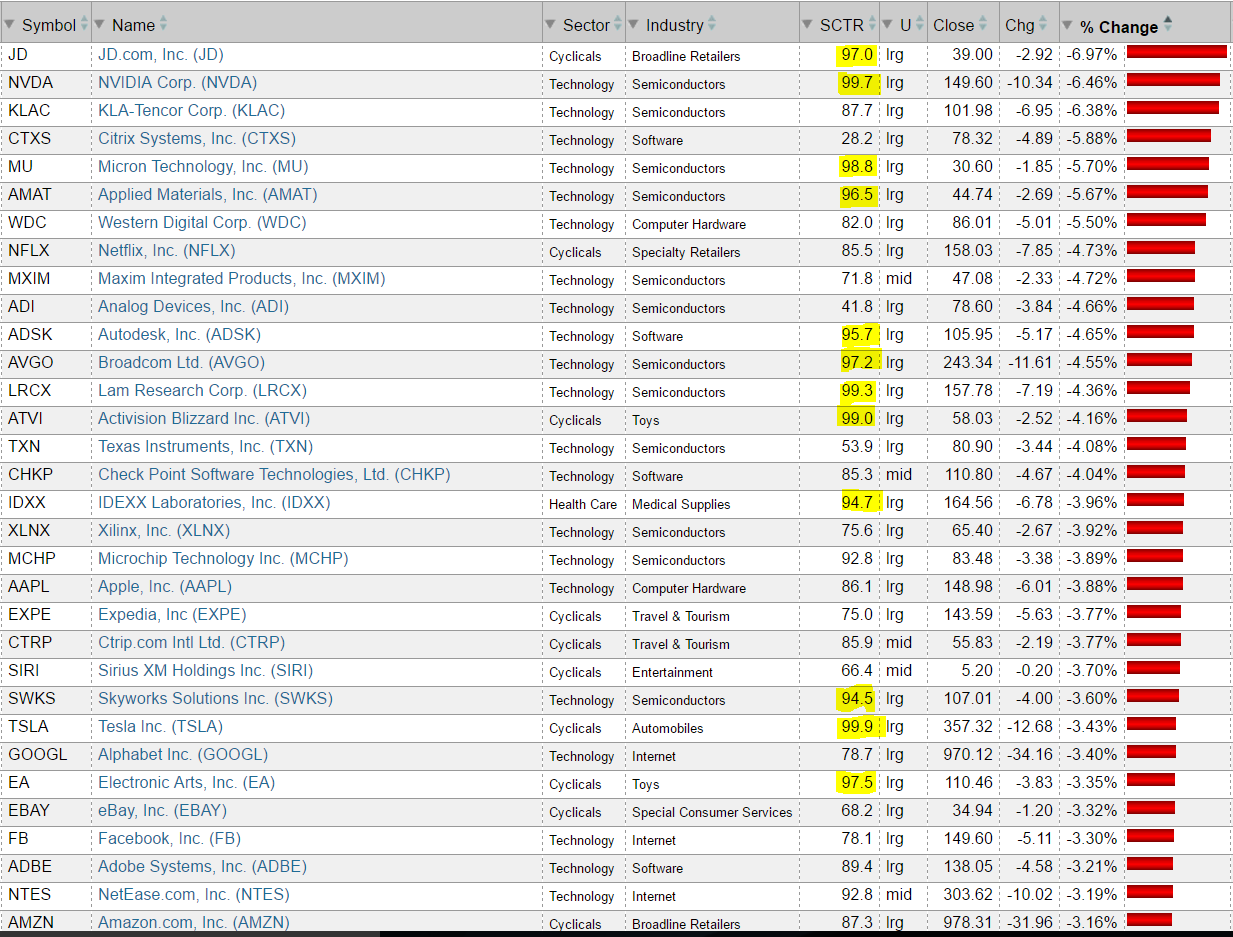 Several of the best performing stocks (based on SCTR scores) were absolutely hammered on Friday. Despite the heavy selling of NASDAQ 100 components, the overall market didn't fare that badly. That was obvious when we look at the performance of our major indices. While the NASDAQ 100 and NASDAQ finished with losses of 2.44% and 1.80%, respectively, the Russell 2000 finished at an all-time closing high and gained 0.43% on the session. Your evaluation of the Russell 2000 performance on Friday really depends on whether you look at it from a "half full" or "half empty" perspective. It was no doubt disappointing to finish on the Russell 2000 at 1422 after trading earlier in the session at 1433. That's a significant reversal. However, with an hour to go to the closing bell on Friday, the Russell 2000 had given up all of its gains and was sitting at 1415. It looked as if it would be a very significant false breakout that likely would have marked a top for awhile. Then the bulls returned in the final hour, providing a big emotional lift into the close and the Russell 2000's first-ever close above 1420. I believe that's bullish, but we'll soon find out as we open today for a new trading week with the Fed's latest meeting on deck.
While the NASDAQ lost 114 points Friday, the Dow Jones managed to post an 89 point gain to close at its highest level ever. The bifurcation occurred because the technology sector (XLK, -2.47%) was the only sector to post big losses. In fact, energy (XLE, +2.41%) and financials (XLF, +1.89%) more than made up for the losses in technology. That rotation kept our major indices (other than the NASDAQ) afloat and signaled that money didn't leave the stock market. It simply moved to other areas. Depending on the FOMC decision on Wednesday, it looks as if financials are ready to resume their earlier leadership role.
Banks ($DJUSBK) managed to finish very strong and break right shoulder resistance. That "potential" head & shoulders top now looks like a shell of itself. Volume supported the move higher in banks and other financial areas and I believe that's a very bullish development. Here's the latest look at banks:
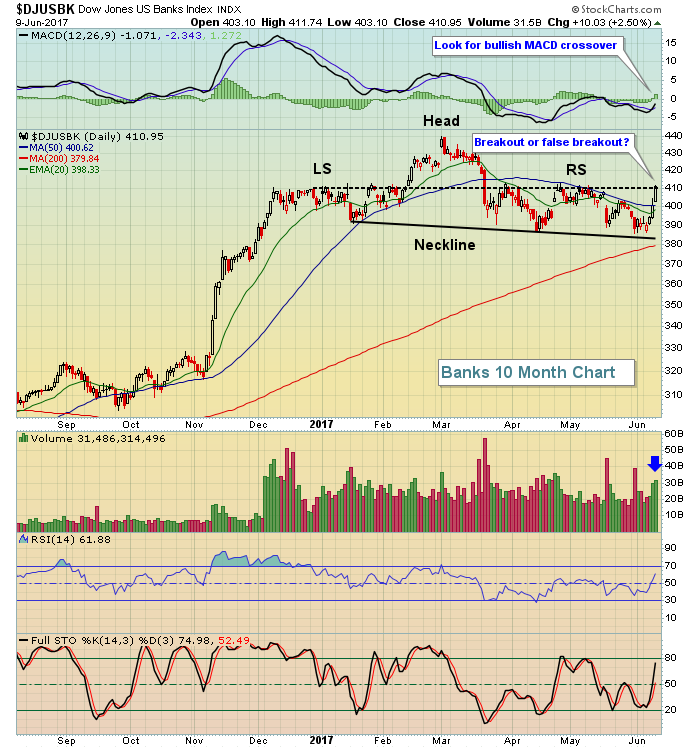 Looking back at this head & shoulders pattern, you could argue that there have been a few false breakdowns on recent lows depending on which lows you connect for the neckline. So technically Friday's move higher and close above 410 could be a false breakout, right? We'll know more later today when we see if banks can continue to push higher with solid volume. I like the volume that accompanied the banks move higher last week. A typical right shoulder forms with light volume. One confirming signal to look for would also be a bullish MACD crossover (MACD crosses from beneath its centerline, or zero line, to above reflecting the resumption of bullish momentum).
Pre-Market Action
It's a quiet morning in terms of economic and earnings news, but there's a lot of anticipation of the Fed meeting that begins tomorrow and ends on Wednesday at 2pm EST. Right now, it appears that Friday's selling is likely to resume in technology stocks when the opening bell rings in 30 minutes. NASDAQ futures are down significantly, but Dow Jones futures are currently lower by just 14 points.
Current Outlook
It's probably a little too early to make this call, but we could be seeing the changing of the guard on Friday in terms of market leadership. Depending on the outcome of the Fed meeting this week, financials could be poised to provide the market leadership necessary to keep the bull market alive and strong - even if we see further deterioration in technology stocks. Rotation is central to a bull market. Rotation keeps money invested in equities, whether it's technology, financials, industrials, whatever. We have seen incredible relative strength in NASDAQ stocks so it's not surprising to get a bout of profit taking. Here's a relative chart (vs. the benchmark S&P 500) to get an idea of where we might find some relative price support:
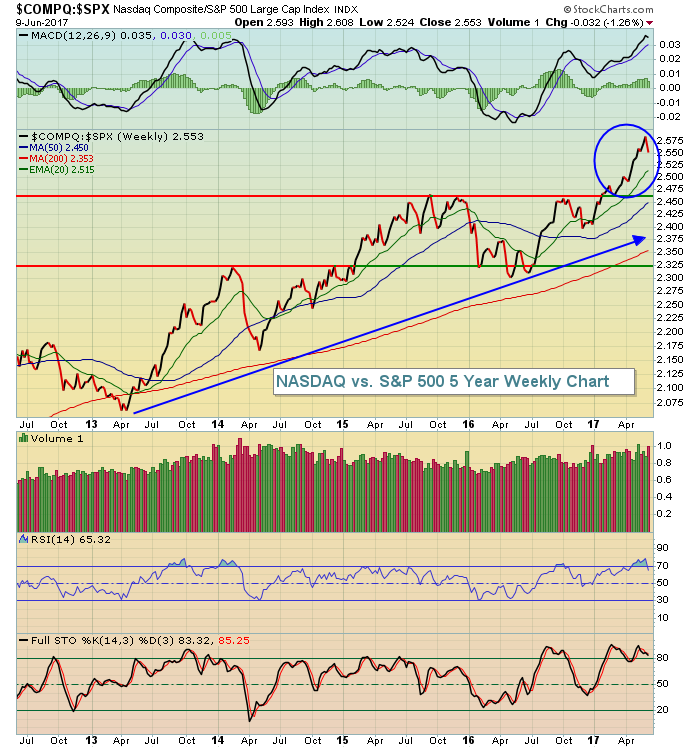 The NASDAQ has been performing at an unsustainable relative strength clip in 2017 and simply deserves a break. Don't be shocked if we see this relative ratio drop throughout the summer months when higher risk investments tend to struggle historically. Consider trading out of higher risk stocks and into more defensive leaders this summer.
Sector/Industry Watch
Technology (XLK) took a beating on Friday and the reasons are quite obvious. First, the group has been overbought much of 2017 and simply could use some selling to relieve these conditions. Second, the semiconductors ($DJUSSC) had risen more than 10% in the last month prior to yesterday, making the industry group not only the best performing industry within technology, but also the best performing industry group PERIOD over the past month. It should be no shocker that the DJUSSC was the worst performing industry group on Friday. Take a look at the technical outlook for the DJUSSC now:
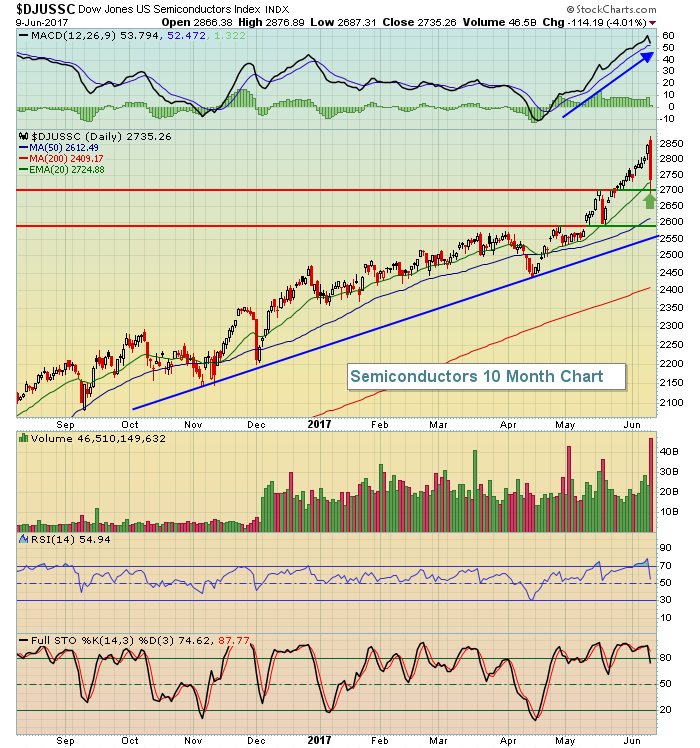 The heavy volume selling on the DJUSSC wiped out a few weeks' worth of gains in a single day and violent bouts of profit taking on volatile groups can take a few sessions to complete. Therefore, be very careful trying to predict a bottom intraday. I've offered up several potential support levels to watch. The first two, the rising 20 day EMA and price support near 2700, were both tested on Friday - and held. But with NASDAQ futures pointing much lower this morning, we're likely to open beneath both of these support levels and that will bring into play the price support level just beneath 2600, then rising trendline support closer to 2560. I'd be a trader on the long side if the 2560-2600 area is tested. It's going to be a very interesting day.
Monday Setups
After Friday's big selloff, I'd keep two things in mind. First, it's likely to be extremely volatile with regard to those high SCTR stocks that were trounced on Friday. Many of these stocks will have wide trading ranges and sudden shifts. While many traders love that volatility, I think it's a very risky environment that I prefer to avoid - for the most part. I'll likely be looking at "boring" stocks to trade this week, many of which should avoid the wild bouts of Friday's selling episodes.
Second, when the increased selling pressure picks up, it's more important than ever to keep your stops in place. So if you enter a stock, just be sure you recognize the point at which you need to bail to preserve capital.
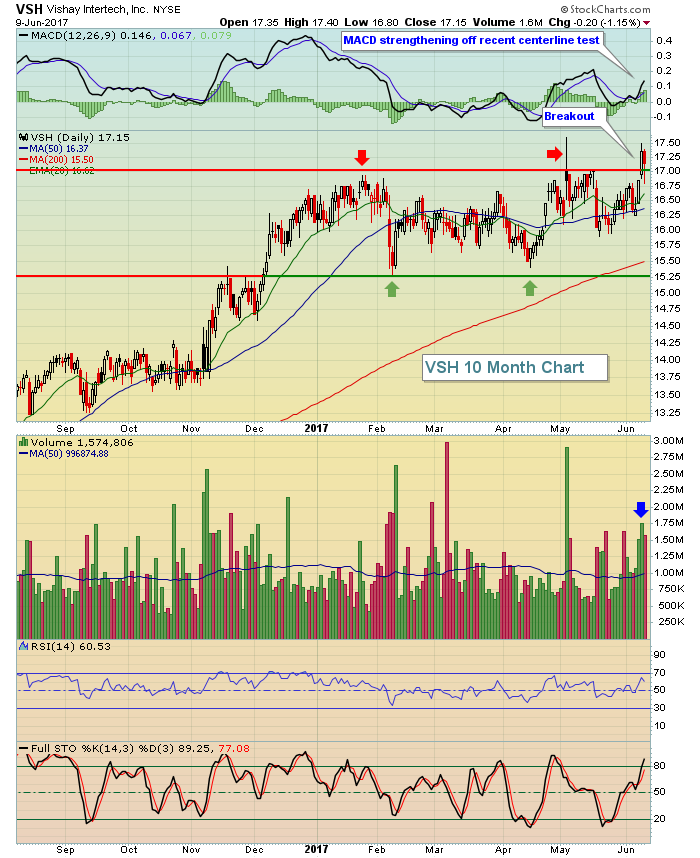
Sticking to these two principles, I like Vishay Intertech (VSH). It's in the technology area, but hasn't been caught up in the huge upside moves that many in the group have seen and it currently sports a SCTR score of 65. It broke out on Thursday with heavy volume after a long-term base and managed to hold up fairly well on Friday despite tons of selling in technology. Here's the chart:
 I'll discuss VSH and other Monday setups during MarketWatchers LIVE today. The show begins at noon EST and the Monday setups will be discussed during our first segment between 12:05pm-12:20pm EST. Please join me if you can! To join, simply click on the link above after 11:45am EST and you'll see the "On Air" button. Click on that and follow the brief instructions to register.
Historical Tendencies
The Russell 2000 broke out and closed at an all-time high on Friday. Seasonally, it makes sense as the Russell 2000 tends to perform well until we finish June. July, August and September have produced average returns of -1.0%, -1.2% and -0.7%, respectively, over the past two decades so small caps will be trying to add to their recent strength prior to these historically bearish summer months.
Key Earnings Reports
None
Key Economic Reports
None
FOMC meeting begins Tuesday and concludes Wednesday 2pm EST with FOMC policy statement
Happy trading!
Tom
