Reminder
I post a blog article every morning that the stock market is open in a format similar to today's article. If you haven't already subscribed (for FREE) and would like to, simply scroll to the bottom of this article and type your email address into the space provided and click on the green "Subscribe" button. From this point forward, my blog article will be sent to the email address provided immediately upon being published. Thanks for your readership and support! :-)
Also, your comments - good or bad - are always welcome. My email is tomb@stockcharts.com.
Market Recap for Thursday, November 15, 2018
If only for a day, technology stocks (XLK, +2.51%) resumed its leadership role. And it's likely to only be one day after two ugly quarterly earnings reports in the semiconductor space ($DJUSSC, +3.22%). This industry group will almost certainly be under intense selling pressure when the opening bell rings, but I'll be most interested in what happens after the bell rings. Any chartist would recognize that NVIDIA's (NVDA) and Applied Materials' (AMAT) earnings reports were not likely to be good. Both stocks have been spiraling lower for months - NVDA has lost 1/3 of its market cap since October 1st when it was trading at an all-time high and AMAT has been nearly cut in half since hitting $62 per share in March. Everyone should have predicted poor results, but will see an exhaustive selloff at today's open? Are these both cases of "sell on rumor, buy on news"? Today's candle will tell the story.
Financials (XLF, +1.48%), energy (XLE, +1.47%), materials (XLB, +1.37%) and industrials (XLI, +1.32%) all gained more than 1% on the session. Leading financials was the group that's led throughout much of the past couple years - financial administration ($DJUSFA, +2.44%) - as Square (SQ, +5.43%) and PayPal (PYPL, +3.20) both enjoyed solid days. The DJUSFA appears to have completed a bullish inverse head & shoulders continuation pattern with yesterday's bullish engulfing candle:
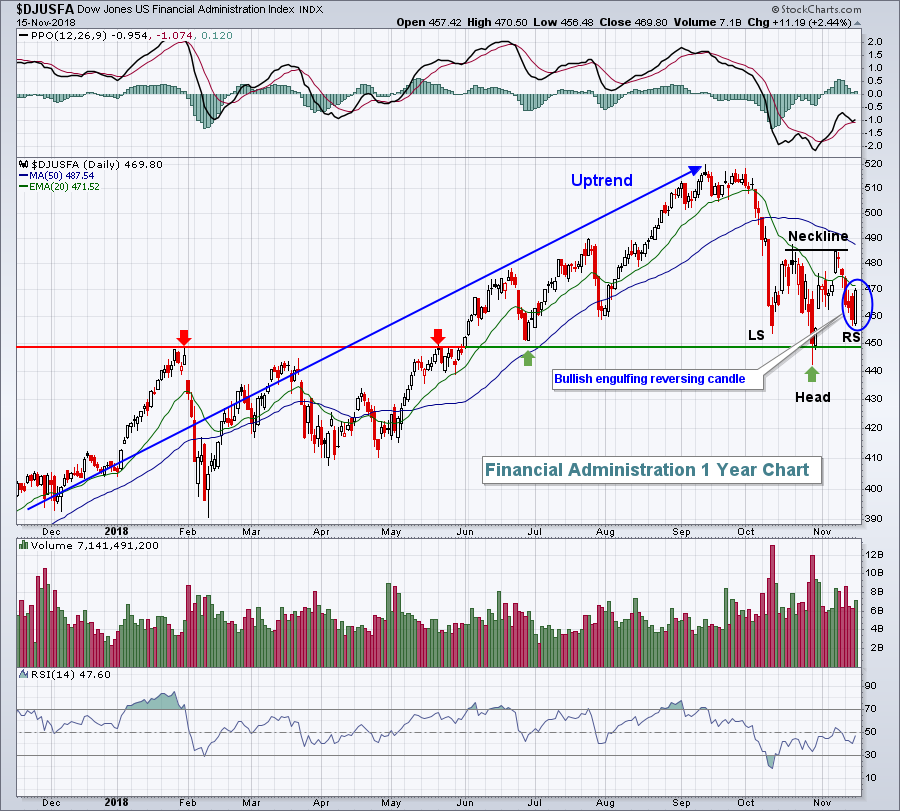 Remember one thing. A bullish pattern isn't a pattern until it's confirmed with a breakout to execute the pattern. That would require a close above 486 and heavy volume to accompany the breakout would add significance to the breakout and pattern.
Banks ($DJUSBK, +1.96%) also enjoyed a very strong session as the 10 year treasury yield ($TNX) reversed to close at 3.12% after touching 3.08% intraday.
Pre-Market Action
Crude oil ($WTIC) continues to find support and buyers as it attempts to reverse the huge slide that began six weeks ago from $77 per barrel. We saw a Tuesday low just beneath $55 per barrel. This morning, crude is up more than 2% to $57.66 at last check. That should help the energy ETF (XLE), which has easily been the worst performing sector over the past month and a half.
The Fed's Richard Clarida suggested that the Fed is moving closer to "neutral", suggesting that economic data ahead will determine whether the Fed's policy will be one of loosening or tightening. Those comments have money rotating towards treasuries this morning, with the 10 year treasury yield ($TNX) falling back to 3.09%, a drop of 3 basis points to challenge yesterday's low.
Asian markets were mixed overnight, while European markets are clearly lower. That European weakness, along with a couple not-so-great earnings reports last night, has U.S. futures on the defensive. Dow Jones futures are lower by 153 points with 30 minutes left to the opening bell. On a percentage basis, NASDAQ futures look to open even lower.
Current Outlook
The near-term downtrend on the S&P 500 was ended yesterday during the afternoon buying spree, or was it? Recently, I've provided charts showing that the declining 20 hour EMA has provided overhead resistance on bounces. Well, that changed yesterday as price surged above both the 20 hour and 50 hour moving averages. Furthermore, when selling kicked in, the now-rising 20 hour EMA held as support:
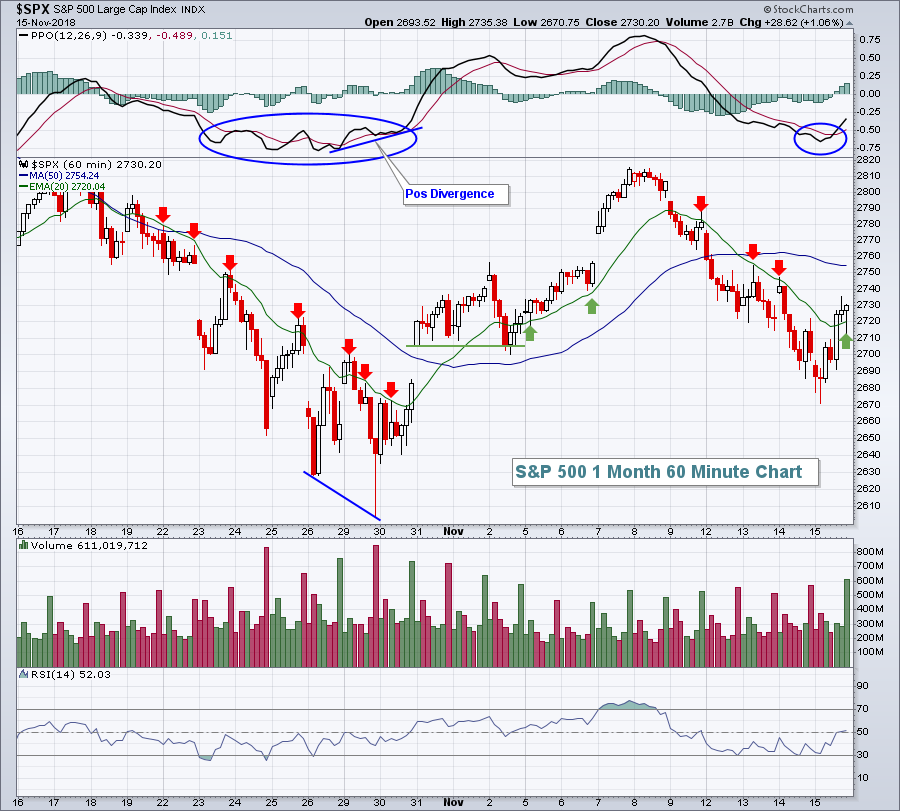 But the October selloff ended with a much more predictable pattern as momentum slowed (positive divergence printed) as we neared a bottom. There was no such pattern yesterday. We filled gap support down to the October 30th close and then the buying began - all with the PPO accelerating lower. Is this just a blip to the upside within a bigger picture of selling? Today will likely provide us some clues. Futures are weak on the heels of several ugly quarterly earnings reports from high profile technology names like NVIDIA (NVDA) and Applied Materials (AMAT). Semiconductors ($DJUSSC) provided technology and the overall market a big lift on Thursday, but are likely to be under considerable pressure today given those two earnings reports.
Sector/Industry Watch
Health care providers ($DJUSHP, +0.20%) recovered yesterday after short-term gap support was tested. We've seen recent underperformance in the DJUSHP relative to the benchmark S&P 500, but the longer-term outperformance can easily be seen in the chart below:
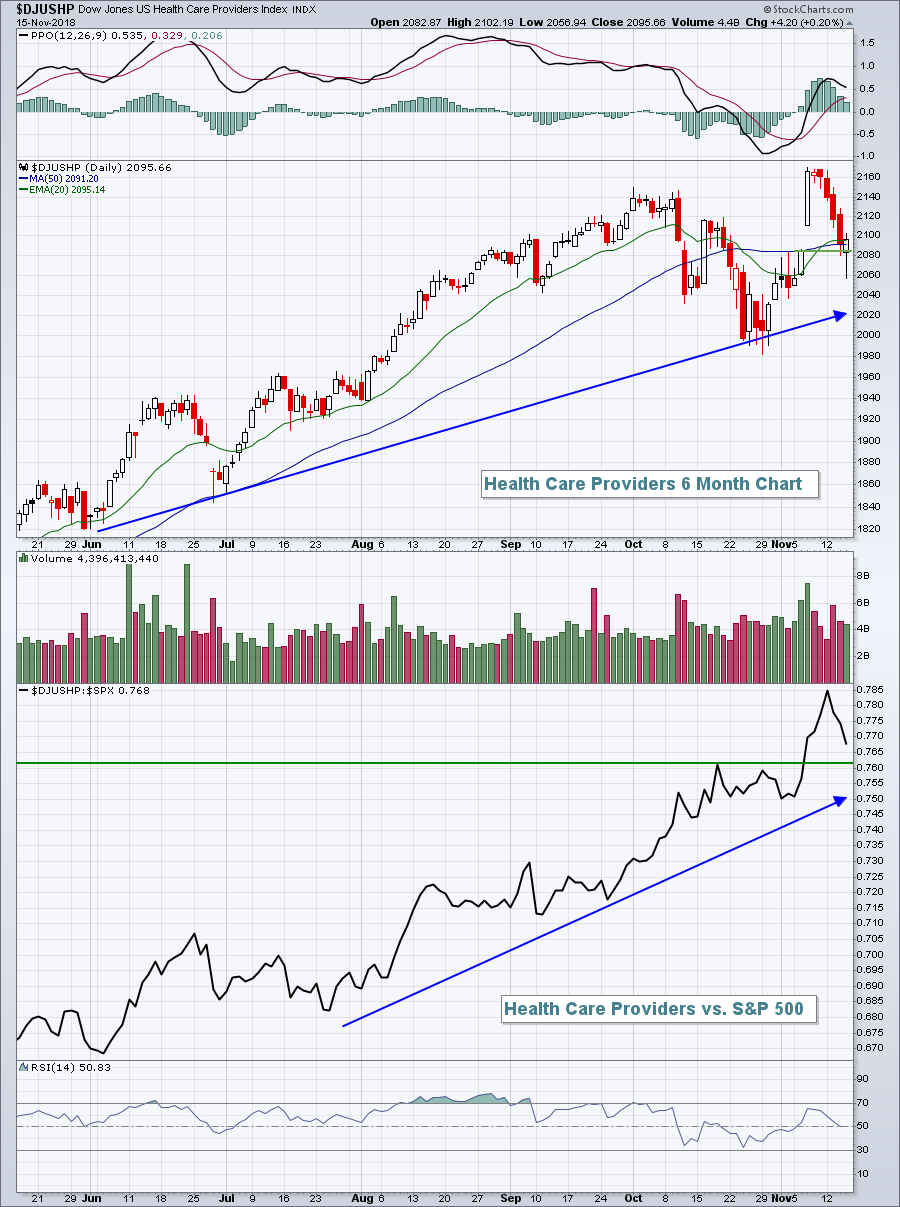 The reversing candle suggests that a key short-term price low has been established as buyers re-emerged just below the 2060 level. I'd expect to see that level hold as support if tested overall market weakness resumes and the DJUSHP tests 2060. In the meantime, the recent selling is likely providing for entry into stocks in this space for solid short-term reward to risk opportunities.
Historical Tendencies
The small cap Russell 2000 has certainly had its issues the past couple months, significantly underperforming the S&P 500 despite a stronger U.S. Dollar ($USD). But from a seasonal perspective, the RUT is about to enter two crazy bullish periods, sandwiched around one brief bearish period. Check out the RUT's annualized returns since 1987 for the calendar periods below:
November 23rd through December 6th: +70.55%
December 7th through December 15th: -41.20%
December 16th through December 31st: +73.06%
December has easily been the best performing calendar month for the RUT over the past three decades. Given the strong dollar backdrop, I'd look for significant outperformance by small caps from now through year end.
Key Earnings Reports
(actual vs. estimate):
VIAB: .99 vs .95
Key Economic Reports
October industrial production to be released at 9:15am EST: +0.2% (estimate)
October capacity utilization to be released at 9:15am EST: 78.2% (estimate)
Happy trading!
Tom
