Market Recap for Monday, August 12, 2019
The flight to safety was clear on Monday. The 10 year treasury yield ($TNX) tumbled once again, falling 9 basis points to 1.63%, inching closer and closer to the historic TNX lows that were set in 2012 and 2016. The all-time low came at that 2016 bottom as the TNX touched just below 1.34%. Yields fall when treasury prices rise. So large drops in the TNX can be construed as a major flight to safety.
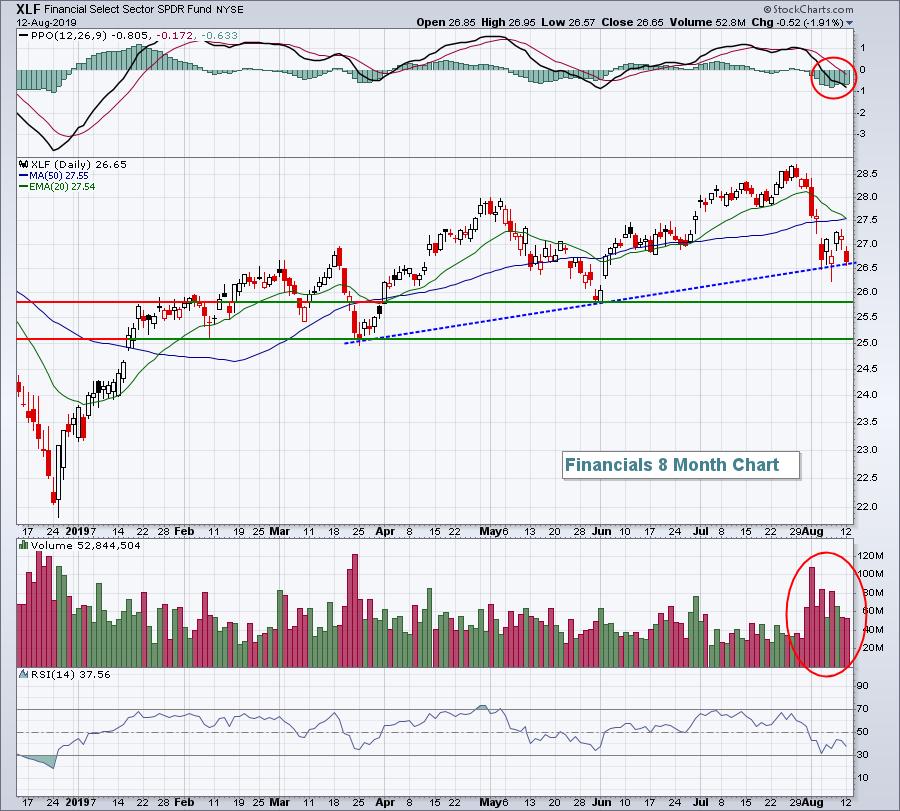
This flight to safety was also apparent in our equity markets. All of our major indices fell on Monday, led by the Dow Jones' 1.49% drop. The other key indices fell approximately 1.20%. All 11 sectors suffered losses, but the defensive groups easily led on a relative basis. Real estate (XLRE, -0.08%) and utilities (XLU, -0.20%) mostly held their ground, but the same could not be said for financials (XLF, -1.91%). Financials are interest-rate sensitive, typically rising when treasury yields rise. Unfortunately, the XLF, not too surprisingly, is down 5.90% during this month-long drop in yields:

The XLF is currently testing a short-term trend line and a break below that would likely lead to a price support test just below 26.00.
Pre-Market Action
The 10 year treasury yield ($TNX) is flat this morning. Gold ($GOLD), however, remains in favor as global tensions escalate and amid an overall flight to safety. Gold tends to be a fan favorite during equity selloffs so that's not hurting either.
In Asia overnight, Hong Kong's Hang Seng Index ($HSI) fell more than 2% and is quickly approaching the low set in early 2019. That will be an important level for this beleaguered country and index.
Europe is also struggling this morning and all this global weakness is carrying over into U.S. futures. Dow Jones futures are down 67 points with 30 minutes left to the opening bell.
Current Outlook
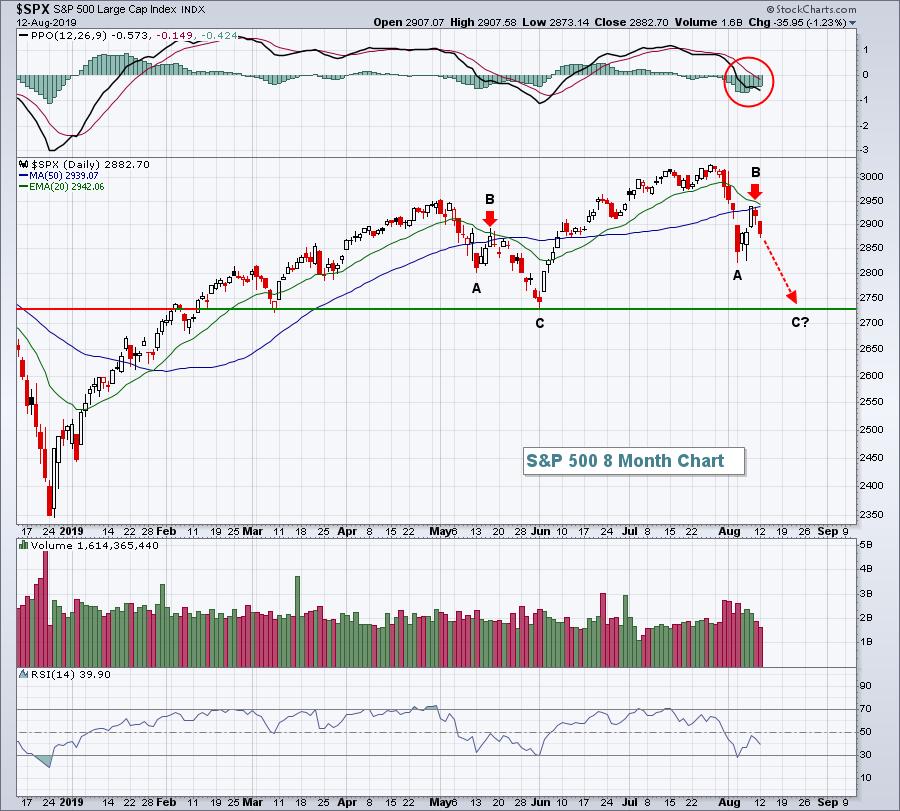
There doesn't appear to a major intermediate-term bottom in place just yet. The bounce last week failed before we could get a 20 day EMA test and the selling yesterday appears to have sparked another downturn. The Volatility Index ($VIX) surged more than 17% back to 21 and we know from history that any move in the VIX above 20 needs to be respected. We could be in a 10% correction, which would take us down to test the March and June low near 2725. That wouldn't be a horrible thing technically as further consolidation would add more meaning to the next breakout to all-time highs. I believe those highs are coming in a big, big way, but first this period will need to be negotiated. Here's a possible scenario for an A-B-C correction similar to one we saw in May:

A break below the double bottom would be much more bearish and would require further evaluation. Until then, consider any further selling as a buying opportunity in stocks showing relative strength.
Sector/Industry Watch
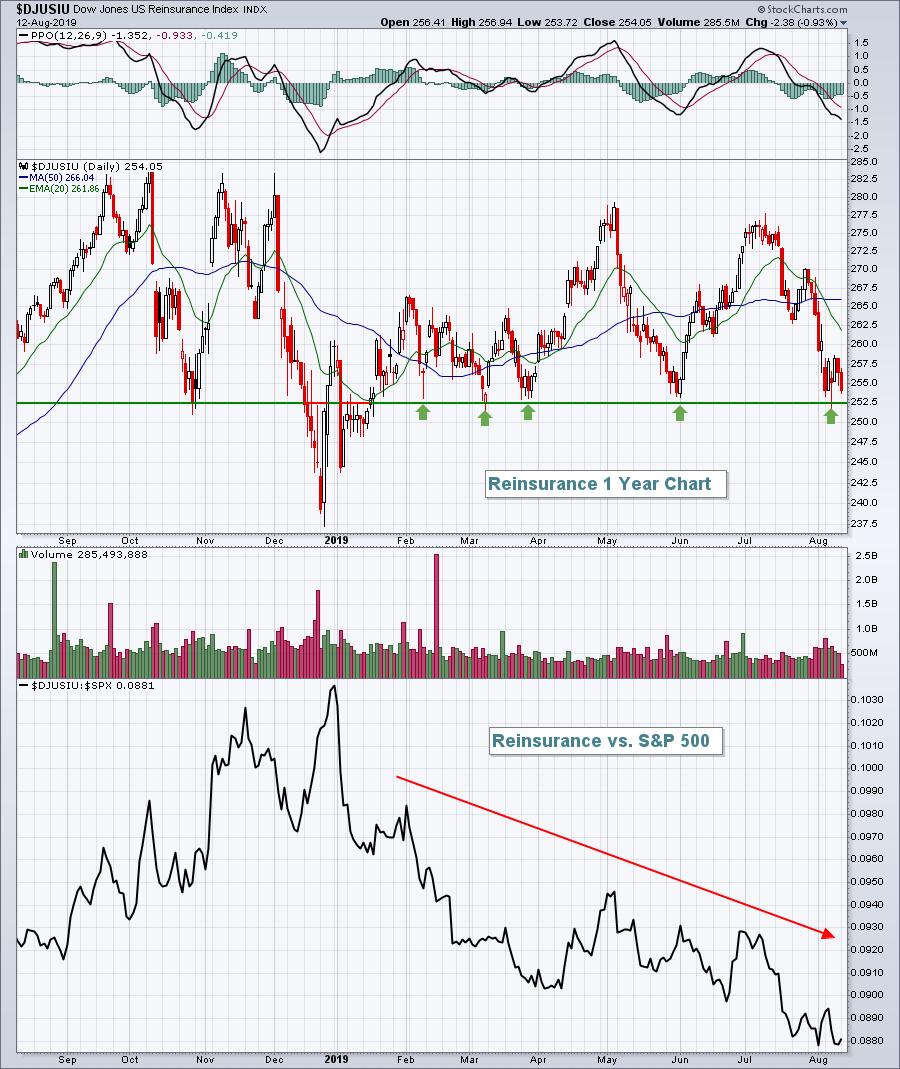
The Dow Jones U.S. Reinsurance Index ($DJUSIU, -0.93%) was very weak on Monday and is now threatening to get a whole lot weaker. The DJUSIU has tested or nearly tested the 252.50 price support level on 5 separate occasions in 2019. When a stock or index shows that kind of support and buying interest at a key level, losing that level can be particularly bearish:

The DJUSIU has been trading mostly sideways in 2019, underperforming its benchmark S&P 500 index throughout. A breakdown of price support would only add to its woes. I'd avoid the group completely until we begin to see an uptrend and relative strength.
Speaking of relative strength, the EarningsBeats.com Digest is a free newsletter that focuses on earnings and relative strength, uncovering great opportunities, while avoiding stocks and industry groups out of favor. To sign up and begin receiving your free articles, CLICK HERE.
Historical Tendencies
We are in the best historical period during August. The NASDAQ has produced annualized returns of +27.64% for the period August 11th through August 17th since 1971.
Key Earnings Reports
(actual vs. estimate):
AAP: 2.00 vs 2.22
CVET: .12 vs .16
EAT: 1.36 vs 1.35
ELAN: .28 vs .26
GDS: (.11) vs (.14)
IIVI: .67 vs .67
JD: .33 vs .09
PSN: .43 vs .63
(reports after close, estimate provided):
ADPT: (.15)
CDK: .91
GO: .13
HUYA: .08
LTM: (.13)
MYGN: .47
TLRY: (.23)
YY: .88
Key Economic Reports
July CPI released at 8:30am EST: +0.3% (actual) vs. +0.2% (estimate)
July Core CPI released at 8:30am EST: +0.3% (actual) vs. +0.2% (estimate)
Happy trading!
Tom
