Wyckoff Power Charting May 27, 2016 at 11:25 AM

Let’s continue our discussion of scanning the market with a top down approach. Recall that we proposed a process of first evaluating the stock market (S&P 500), followed by the Sectors and then the Industry Groups... Read More
Wyckoff Power Charting May 19, 2016 at 07:22 PM

Finding the best emerging stock ideas can seem like finding a needle in a haystack. The goal is to organize your market analysis in such a way that you can drill down into the market structure and find leadership quickly and efficiently... Read More
Wyckoff Power Charting May 12, 2016 at 06:33 PM

We have reached the one year anniversary of the Wyckoff Power Charting blog. Many thanks for being enthusiastic and supportive readers. Let’s pause and look back at what we did in the first year. Richard D... Read More
Wyckoff Power Charting May 06, 2016 at 03:49 PM

Stepping Stone Reaccumulation (SSR) formations are significant yet common. An SSR is a pause where the stock rests before resuming the uptrend... Read More
Wyckoff Power Charting May 03, 2016 at 04:05 PM
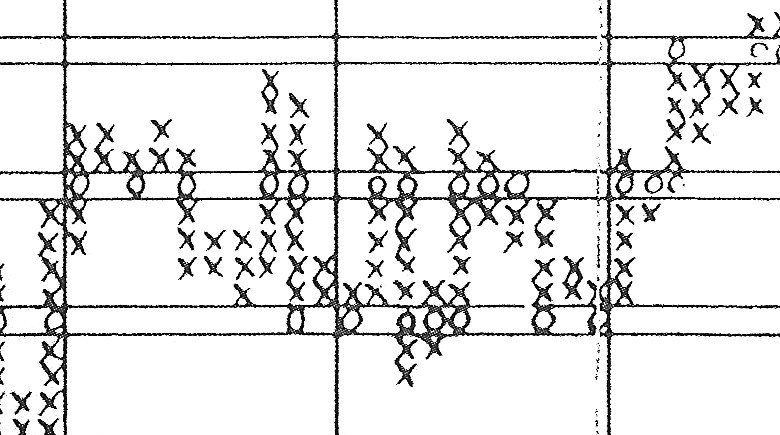
The concept of Cause and Effect is at work in markets constantly. This Wyckoff Law is codified and measured using Point and Figure charts. These charts are robust tools for measuring market potential or cause that has been built and then expended... Read More