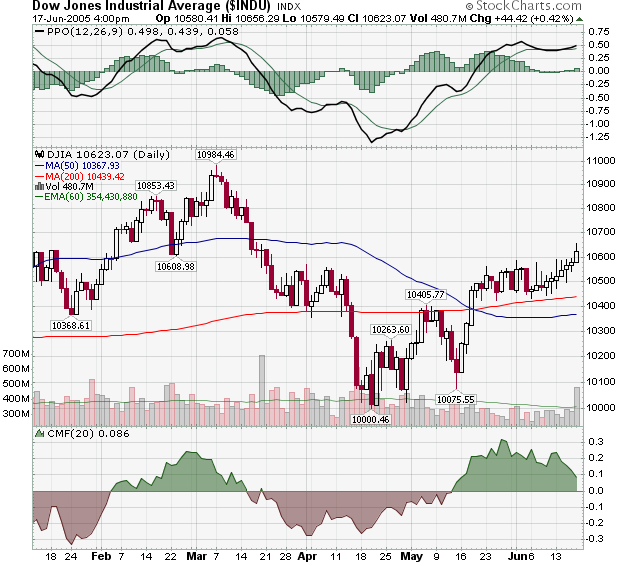
Seven straight days of gains has moved the Dow back above the 10,600 level - something that looks even more impressive given Friday's significant volume increase. Next week should see a test of 10,600 as the index tries to consolidate its gains. Watch closely to see if 10,600 has turned into support or not. If it has, the market should be able to move towards the next resistance level (10,800) relatively quickly.
Let's see what our other commentators think...
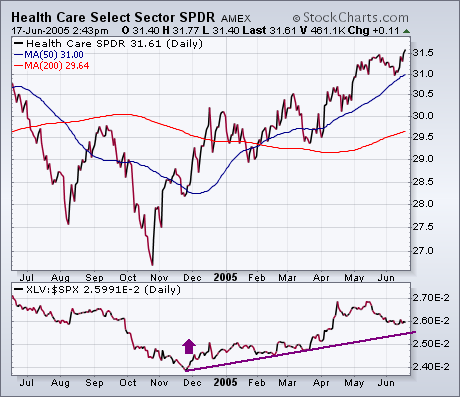
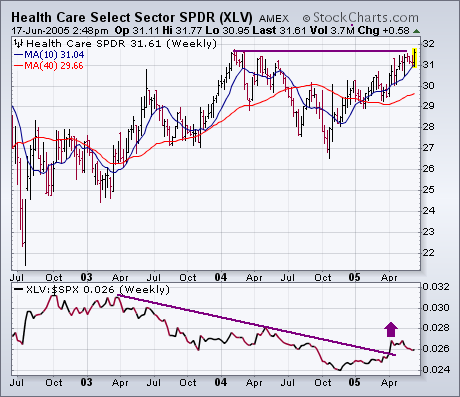
While a lot of attention has been paid to rising energy and basic material stocks this week, not much has been written about healthcare. It's time to correct that. Chart 1 shows the Health Care Sector SPDR (XLV) closing the week at a new 52-week high. [The only two other sector SPDRS to hit new highs were energy and utilities]. The relative strength ratio shows that healthcare started to do better than the S&P 500 near the end of last year. Although the relative strength line has been slipping of late, its trend is still higher. How much higher can be seen more plainly Chart 2 which shows that the healthcare relative strength ratio has broken a down trendline starting in the spring of 2003. That makes some sense. Healthcare is considered to be a defensive sector and would be expected to underperform during a cyclical bull market. Its stronger performance during 2005 is another sign that investors have been favoring more defensive stock sectors. Earlier in the year I listed healthcare as one of my favorite picks for the year. I haven't changed my mind. Chart 2 also shows that the XLV is challenging its 2004 peak. A lot of today's buying came from biotechs.
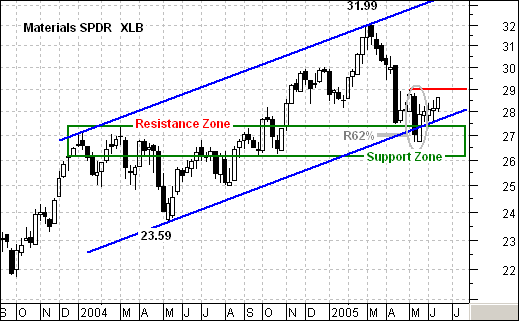
The Materials sector was all the rage in 2004, but fell on hard times in 2005. After a run from 23.59 to 31.99 (35%), the Materials SPDR (XLB) declined below 27 with a sharp decline. Was this enough to break the uptrend or is this just a sharp correction? The bulk of the evidence points to the latter.
Even though the decline was sharp and a classic corrective pattern failed to take shape, other technical signs point to a correction. First, the decline retraced around 62% of the prior advance. This Fibonacci number (percent) is normal for a correction. Second, the decline returned to broken resistance. Notice that the resistance zone around 26-27.5 turned into a support zone. This is also typical for a correction as there is often a throwback to broken resistance after the breakout. Third, the lower channel trendline confirms support around 27-28. I drew the upper trendline first and then based the lower trendline (parallel) on this upper trendline. The stock pierced the lower trendline, but quickly recovered and managed to stabilize over the last few weeks.
Stability is one thing, but a reversal is another. The stock formed a long black candlestick in May and then recovered the very next week (gray oval). A piercing pattern formed and this is a bullish candlestick reversal pattern. Confirmation is required though and I would look for a move above 30 to complete a reversal and expect a move higher.
While persistently rising prices are frustrating the bears and encouraging the bulls, there is evidence that distribution is taking place.
On the first chart I have circled areas where daily volume has scooped below its 250-EMA line, indicating that there was inadequate sponsorship of the rising trend. In each of the first three cases shallow volume preceded price corrections. The current volume dip, which has lasted about six weeks, has yet to be resolved, but it seems reasonable to expect a correction fairly soon, probably starting soon after we see final expansion of volume.
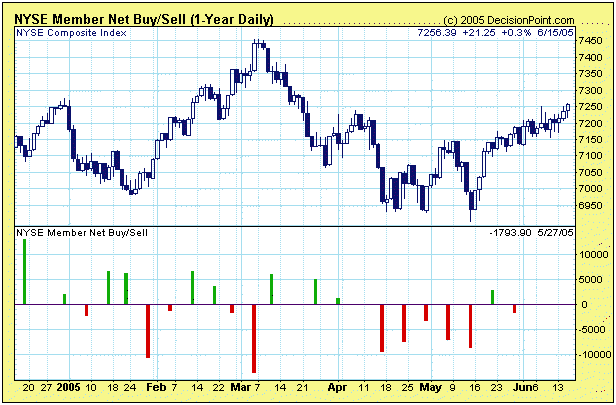
The second chart shows a five-week period of NYSE Member Net Selling, which is a fairly unusual because these insiders are normally accumulating shares into declines (shares that will be sold during the next advance). The NYSE delays reporting of these numbers by two weeks, so there is a big question mark as to what Members have been doing during the last three weeks; however, the large amount of net selling raises a red flag, especially when viewed in the context of the shallow volume problems discussed above.
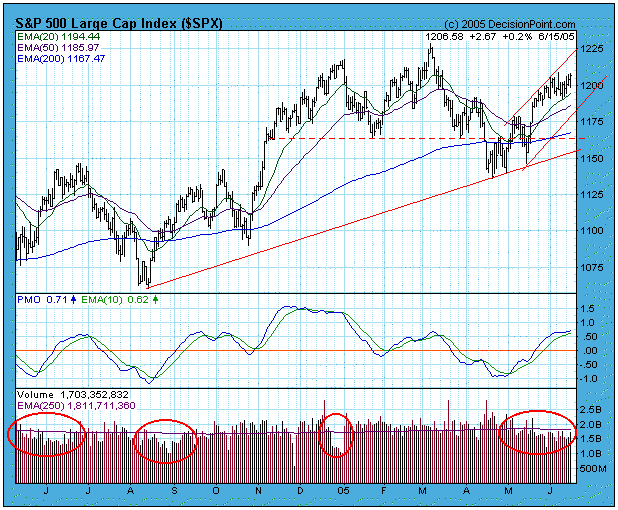
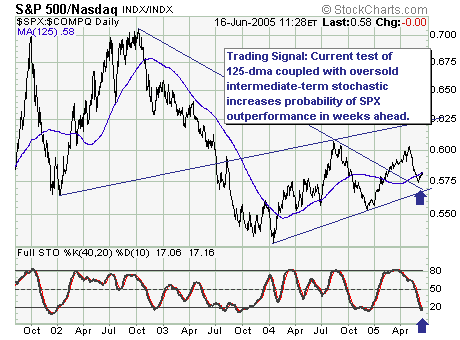
The recent S&P 500 price action above the 1190 level is rather impressive, and can be considered a correction in 'time' rather than in price. This suggests new highs; however, those highs aren't expected to be accompanied by new highs in the Nasdaq Composite.
As the chart shows, S&P 500 large caps have outperformed the technology sector since January-2004 in a 'sawtooth' pattern. I think the S&P 500 is ready to outperform once again…and those hedge funds that want to increase beta via technology will left to their own devices given they are chasing performance. Further, this is suggestive of an overall 'market top' in the weeks/months ahead rather than a continuation pattern. Thus we would be sellers of rallies at the appropriate time.