The Dow continues to oscillate around 10,600 without much direction right now - sometimes getting near 10,700 - other times falling as low as 10,500. Now that the two major moving averages (50-day and 200-day) have essentially "merged" near the 10,550 mark, they should provide some additional technical support and may help get things moving again. John, Richard, and Carl have some additional thoughts below however.
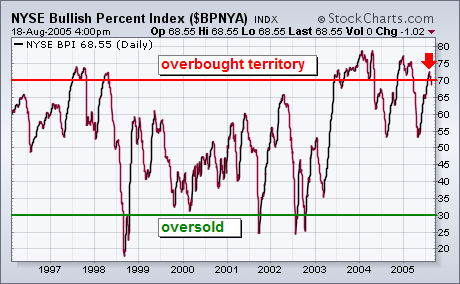
One of the ways to determine if the stock market is in a long-term overbought or oversold area is to chart the NYSE Bullish Percent Index which is shown in the chart below. The BPNYA measures the percent of stocks that are on point & figure buy signals. The two key numbers on the chart are 30 and 70. Readings under 30 show the market in a major oversold condition. Readings over 70 show a major overbought condition. The chart shows that the index traded over 70 three times since the start of 2004. A more dangerous signal is given when the line drops back under 70. That's a sign that the overbought market is starting to weaken. I point this out because the BPNYA has just fallen back below 70 (see red arrow).
There is growing evidence that a bull market top is finally in place, but not all the evidence supports that scenario. For example, the Rydex Cash Flow Ratio shows that bearish sentiment is again approaching record levels, indicating that another run at new price highs could be in the cards.
Decision Point's Rydex Cash Flow Ratio differs from the Asset Ratio in that it is based upon a cumulative total of daily net cash flow for each of the Rydex mutual funds, not raw asset levels. The Cash Flow Ratio is calculated by dividing the total bear fund cash flow plus money market cash by the total bull and sector fund cash flow.
As you can see on the chart, the Ratio (first panel below the S&P 500 graph) has been in a trading range for nearly three years, and the bottom of that range has been a reliable measure of bearish excess sufficient to signal important price bottoms.
Once again the Ratio is approaching the bottom of the range, and bearish cash flow (bottom panel on the chart) is near record high levels. Moreover, this sharp increase in bearish sentiment has occurred with only a minor price decline -- people have gotten too bearish too fast. All this should send up warning flags to the short sellers.
Having said that, let me point out that it is entirely possible for prices to head lower and for bearish cash flow to punch through the resistance to new highs, causing the Ratio to break through the bottom of its range. Also, the failure of bullish cash flow to follow prices to new highs presents a serious negative divergence, indicating that participation has faded significantly.
Nevertheless, the most obvious thing I see on the chart is that sentiment has gotten bearish too quickly, and that is not good news for the bears.
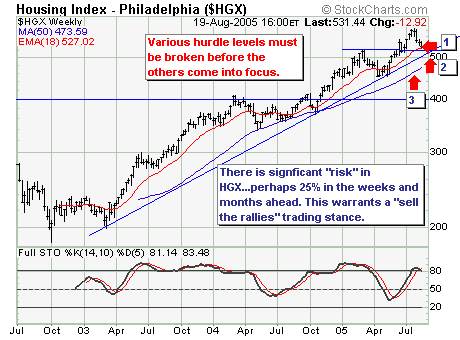
The current broader market decline has brought the Housing Index ($HGX) into clear focus; magazine after newspaper after TV show are talking about whether housing is overvalued and ready for a decline. We will save our thoughts for this for another time, but we do have some technical thoughts on $HGX.
We find the chart trending from the lower left to the upper right and what is defined as a "bull market"; but we are finding opportunities to be short with greater confidence if in fact several 'key levels' are violated. First, we expect the 18-week exponential moving average at 527 to be violated rather handily given all corrections of any magnitude have in fact broken below this key level prior to rebounding. The question then becomes whether the bull market trendline is violated; if so then obviously the bull market from the lower left to the upper right will have 'changed' to bearish. And finally, if the 50-week simple moving average is violated...then this would confirm the downtrend has become engrained indeed.
This is our roadmap; we covered our short housing stocks on Friday and now look to sell rallies given an oversold countertrend rally is warranted. We feel this trade may develop into one of the large for the remainder of this year and into 2006.