NADAQ BREAKSOUT - P&F CHART SHOWS IT BEST
Last week the Nasdaq composite broke through the 2340 resistance level and has moved into territory not seen since the "bubble popped" back in early 2001. The mid-term significance of this development can best be seen on the following P&F chart:
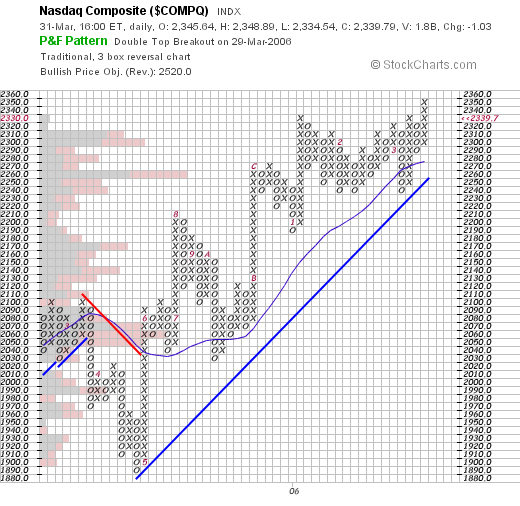
Notice how the right-most column of rising X's has moved higher than the column of X's that appeared at the start of 2006? That "Double Top" breakout is what all of the fuss is about. By moving above the 2350 mark briefly on Thursday, the Nasdaq caused the uppermost X to appear confirming the double top pattern. As long as the index stays above the 2330 level, the pattern will remain intact.
(For more on P&F charts and P&F patterns, please see our ChartSchool article on the topic. While they might look strange at first, P&F Charts are invaluable for understand the major trends and patterns for an stock or index.)
In addition, notice three other bullish developments on this chart:
1.) The long-term trendline is coming into play now and should provide upward support soon. (P&F trendlines are always at 45-degrees).
2.) The 20-column MA is also starting to provide some support.
3.) The Price-by-Volume histogram shows lots of "up" (black) buying at the 2310 and 2320 levels - a good indication that a strong support area has formed there.
Are there warning signs to go along with this rosy picture? Of course. The Fed continues to raise interest rates. Depending on who you talk to, the yield curve is either flat or inverted. The large-cap indices are showing signs of weakness. Etc.
But it sure feels good to have the Nasdaq back and setting the pace again, even if it is only for a little while.
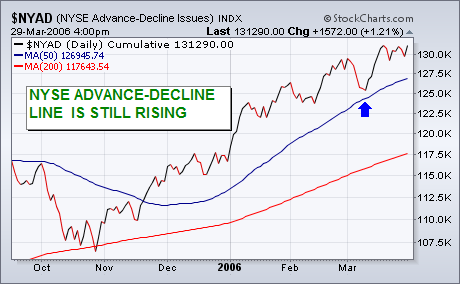
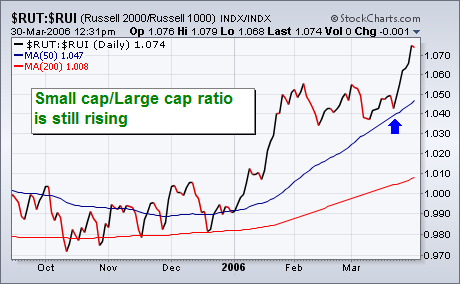
Rising interest rates can help the stock market over the short- to intermediate-term because it implies economic strength. It also causes some money to rotate out of falling bond prices and into stocks. Although rising bond yields usually cause problems for the market eventually, we have to watch the market indexes and certain technical indicators to spot when that's happening. One of those is the NYSE Advance-Decline line as shown in Chart 1. As of right now, the AD line is still rising. Historically, the AD line has peaked either before the market or coincident with it. The fact that it's still rising tells us the market's uptrend is still intact. And it will remain intact as long as the NYSE AD line stays over its 50- and 200-day moving averages. Another sign of strength is coming from small cap stocks. Chart 2 shows a ratio of the Russell 2000 Small Cap Index divided by the Russell 1000 Large Cap Index. The ratio has just broken out to a new high. That shows continued leadership in small caps. One of the usual early signs of a market top is underperformance by riskier small caps as money rotates to the relative safety of larger issues. That may happen during the second half of the year -- and I suspect it will -- but it hasn't happened yet. In reality, Charts 1 and 2 are linked. There's a correlation between the direction of small cap stocks and the AD line. That's because there are more small stocks than larger ones. Weakness in small stocks is usually one of the main reasons that the advance-decline line starts to weaken. Right now, small cap strength is helping keep the AD line in an uptrend.
In my previous column, I featured the Information Technology SPDR (XLK) with a pair of Dark Cloud Cover reversal patterns. Greg Morris, who wrote Candlestick Charting Explained, informed me that the Dark Cloud Cover pattern is one of the few that uses the previous days high as part of its criteria. I was erroneously using the previous days close. The Dark Cloud Cover forms when the open is above the previous days HIGH and the close is below the mid point of the body of the previous day.
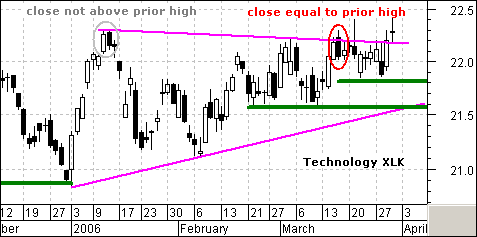
In early January, the XLK open was above the previous days close, but below the prior high. In mid March, the open was equal to the previous days high. Close, but still no cigar. Using the high for the previous day makes this pattern an even more dramatic reversal. It takes a bigger surge to open above the previous days high and a bigger failure to then close below the mid point of the previous days body. This price action shows that buying pressure continued with a strong open, but the bears took control and forced a relatively weak close.
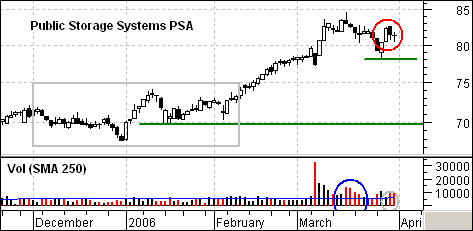
Interest rate sensitive stocks had a rough week and I noticed that Public Storage (PSA) formed a Dark Cloud Cover on Thursday. This stock is part of the REIT group and has enjoyed a nice run up over the last few months. Things could be about to change as the stock declined on above average volume in mid March and then formed a Dark Cloud on above average volume Thursday. A move below 78 would break support from the prior low and confirm the Dark Cloud Cover pattern. My downside target would then be to the support zone around 70.
The overall trend of the market is still up, but there are very few new opportunities surfacing. Taking a look at our primary mechanical timing models below, we can see that nearly all of the broad market and sector indexes are on profitable buy signals, but most of the signals are relatively old and do not offer ideal conditions to put new money to work.
Another problem is that, while the signals are showing a profit, in many cases (like the S&P 500) the profit is rather narrow for the age of the signal, and much of it would be lost if the trend were to change. (It takes about 3% to 4% to generate a signal change.) Nevertheless, I am pleased with how the models have been performing under the circumstances.
The problems reflected by the timing models is also evident in the following chart of the S&P 500. We can see that the trend has been up since the price low in late October; however, the index has been stalled by the resistance at the top of the shallow rising trend channel, which could continue to impede progress for some time to come. And, even in the context of the rising trend channel, prices are due to correct back to at least the bottom of the channel, and that is not a situation that invites renewed risk taking.
While prime opportunities may be few, there are two worth considering. First, the S&P Energy Sector has generated a new buy signal after a short correction. Note that it is bouncing up off the bottom of a rising trend channel.
Also Interesting is the Nasdaq 100 Index. It still failed to pass all the screens necessary to generate a new buy signal, but it is very close to doing so. It too is bouncing off the bottom of a rising trend channel.
While both charts are promising, they represent the modest opportunities found after a correction in an established rising trend. They are not likely to result in the kind of gains we see from deeply oversold bear market lows.
It is especially interesting that the Nasdaq 100 is looking positive at this time. It could provide the required push to keep the broader market rising for a while longer.
I must emphasize, these are not recommendations, and the timing signals are not infallible.
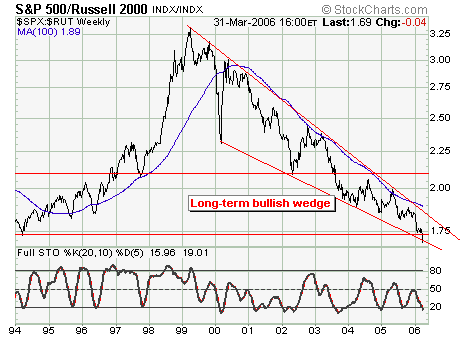
Today we look at large cap vs. small cap stock via the S&P 500/Russell 2000 Ratio. Since 1999, the ratio has gone nowhere other than down; which means this is the 8th year of decline. More generally, the ratio runs in 7 year cycles, so given we are in the 8th year, perhaps the time to consider readjusting ones portfolio is a wise decision. In fact, we believe the winds of change are forthcoming; it may not be today's business or next weeks, but we cannot ignore the developing bullish falling wedge. This, coupled with the oversold 20-week stochastic suggest a trend change; with confirmation coming with a breakout above both trendline and 100-week moving average resistance.
Therefore, the risk/reward dynamic of being long the ratio is rather good bet; certainly this should be on everyone's trading radar going forward.