Hello Fellow ChartWatchers!
I'm pretty busy this weekend and just have time to mention the following things:
Don't forget to grab a copy of
the 2008 Stock Trader's Almanac now so you can plan the start of 2008. John and I both love this thing and recommend it highly.
We're halting John's Video Updates until we can find a better solution for the "fuzziness" problems that YouTube creates. Look for JohnTV (

) to return in a couple of weeks. Until then, John will continue to do Audio updates just like before.
And now, here's John!
Earlier today I showed the Bank Index on the verge of hitting a new low for the year. By day's end, it had fallen to the lowest level in two years (Chart 1). This puts the BKX on track to challenge its 2005 low. In case you're wondering what that means, the BKX has fallen more than 20% from its early 2007 peak. That qualifies as an official bear market in bank stocks. That 5% daily drop helped make financials the day's weakest group. Consumer discretionary stocks came in second worst. Other large losers were small caps and transports. Those are the same market groups that have been lagging behind the rest of the market since mid-year. Although all sectors lost ground, groups that held up a bit better than the rest of market were healthcare, energy, industrials, utilities, and consumer staples. Bonds also had a strong day.

Even though the Nasdaq and the NY Composite hit new closing highs earlier this week, Net New Highs did not keep pace and this could become a problem. Net New Highs equals new 52-week highs less new 52-week lows. I apply a 10-day moving average to smooth the data series and look for crosses above or below the zero line for a trend bias. The bias is bearish when the 10-day SMA for Net New Highs is in negative territory and the bias is bullish when the indicator is positive. On the charts below, the indicator is shown in area format and the underlying index is shown as a red line.
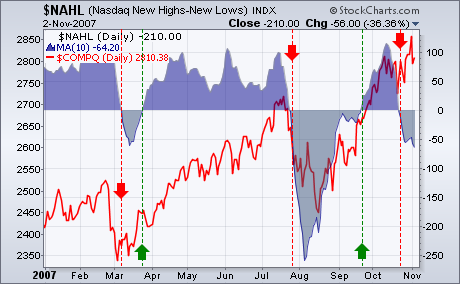
The 10-day SMA for Net New Highs on the Nasdaq moved into negative territory last week. This is quite surprising because the Nasdaq hit a closing high at 2859.12 on 31-October. Despite this new high, there were more new lows than new highs and this undermines the current advance. Something is not quite right. There should be more new highs than new lows when the Nasdaq is trading at or near at 52-week high.
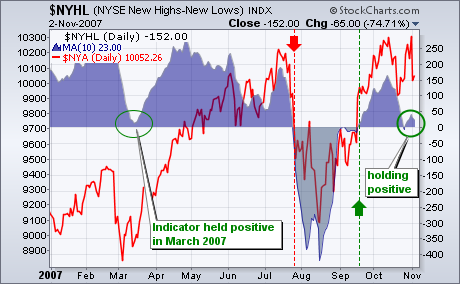
The 10-day SMA for Net New Highs on the NYSE dipped into negative territory last week, but recovered and moved back into positive territory this week. The NY Composite recorded a new closing high at 10311.61 on 31-Oct, but the indicator remained well below its early October high and was barely positive. Net new highs are not keeping pace. There are still plenty of new lows and this reflects bearish undercurrents in the NYSE.
Two weeks ago I stated that a correction had begun, and that the initial selling had resulted in an initiation climax â a technical condition that indicated that the initial down pressure was probably near exhaustion, but that signaled the beginning of a new down trend. My expectation was that there was going to be a bounce (reaction rally), but that more selling would follow after that rally was finished.
This week the rally ended and the selling resumed. It is still my opinion that the selling will probably continue into mid-December where my 9-Month Cycle projection calls for a price low for the correction. A reasonable price target for that low would be 1375 on the S&P 500 Index, but the market segments are very mixed in terms of strength, and there is not conclusive evidence that the market is just going to fall apart.
In spite of the dramatic price moves of the last several weeks, we can see on the chart below that the S&P 500 Index is only about 5% off its all-time high, and strictly speaking a declining trend has not officially been established â it needs to make a lower low.
While the S&P 500 Index is slipping, the Nasdaq 100 Index remains in a rising trend and fully in the bullish mode. We can see on the chart below that it has recently failed to rise to the top of its rising trend channel, indicating some weakness; however, while a correction is virtually assured, there is no reason to expect this segment of the market to enter a bear market.
There are, however, market sectors that are officially in a bear market â Consumer Discretionary and Financials to be specific â and weakness in these sectors is the reason the S&P 500 is struggling.. The chart below is of Financials, but the Consumer Discretionary chart is very similar. Note that a long-term sell signal was generated when the 50-EMA crossed down through the 200-EMA. This signaled the beginning of a bear market for this sector. Once the bear market background had been established, a medium-term sell signal was generated the next time the 20-EMA crossed down through the 50-EMA.
Bottom Line: Technically, the condition of the market is neither overbought or oversold. This leaves room for movement in either direction; however, I am inclined to think that the correction will continue for several more weeks. While there is strength the NDX and in certain sectors, there are a few sectors that are unusually weak. It is not clear which side of the mix is going to prevail.
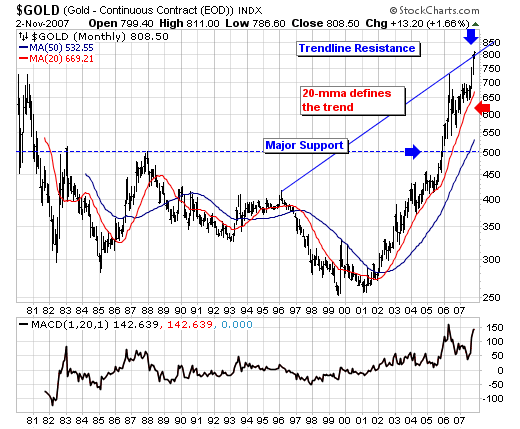
The bull market in commodity has extended beyond what many had believed it would in such a short period of time; be it crude oil prices or gold prices or even wheat prices - the bull market has surprised in its violence. The question before all traders and investors alike is whether the "risk-reward" of holding on to or adding to such positions is tenable. We don't believe it is in any of the aforementioned cases, but we'll only discus the gold market today, for it clearly has a "larger-than-life" following given it bottomed in earnest in 2001.
Quite simply, the rising gold market, and especially given its sharply rise over the past 6-years - has tended to increase the sponsorship of the metal from the engrained "gold bug base" to that of more main stream traders and investors. This is the manner in which bull markets evolve - they increase bull sentiment to the point where the contrarian point-of-view should be considered. We'll posit that point is "now", and while gold prices may very well have residual short-term upside remaining - it pales in comparison to an intermediate-term decline that could carry prices sharply lower from its current perch around $800/oz to somewhere near $600-$650. This wouldn't destroy or harm the bull market in any way whatsoever; however, it would bring sentiment back to more neutral levels upon which the bull market mete out the late longs and therefore can resume its upward trajectory to much higher levels.
Technically speaking, we find the distance above the 20-month moving average is at overbought levels and into trendline resistance that suggests the attendant "risk" is quite high; while potential "reward" is quite low. We need not understand any more than this from a technical perspective. Those who trade aggressively can "pick their places" in which to become short - for the backstop risk of the recent highs serves to limit losses. However, those preferring to "buy" at this juncture - we would simply say "wait", for there is little in the way of support until much lower levels at $675. For our money, we believe in "reversion to the mean", and ultimately in the next several years we are likely to see the 50-month moving average tested as it always it. The burning question is what level that test materializes? We'll further note this moving average is rising on average at $80/oz per year.
Therefore, while we like gold over the longer-term - we're looking for a sharp correction that will shake many late longs to the core. And once this happens - the gold market will be poised to rise farther and further than anyone now believes possible.

 ) to return in a couple of weeks. Until then, John will continue to do Audio updates just like before.


