Hello Fellow ChartWatchers!
Sorry for the ghastly title to this article, but the charts are rather ghastly as the moment and - as the image below shows - the damage is widespread:
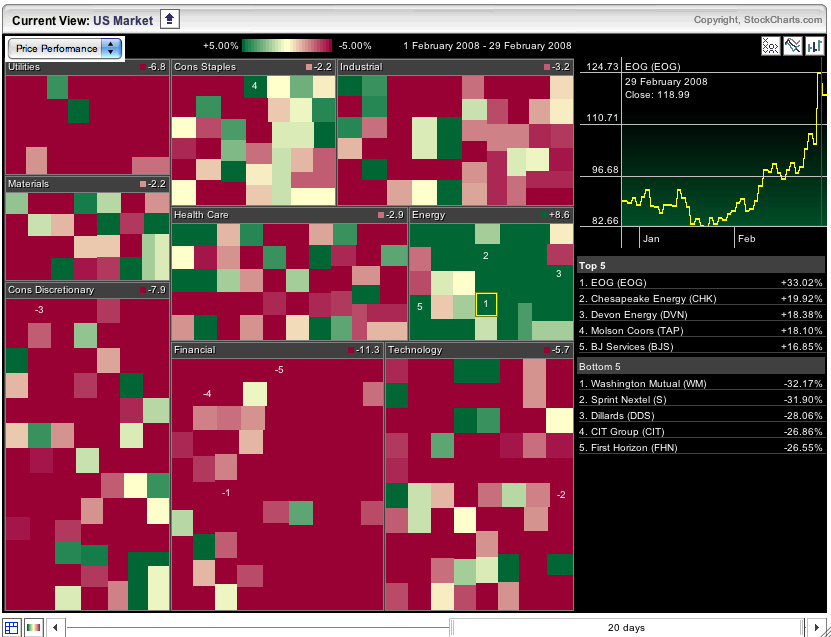
That is a snapshot of our S&P Sector Market Carpet right now. Each stock in the carpet is represented by a colored square. The color of the square is determined by the change in the stock's price since February 1st. Dark red indicates a greater than 5% loss; dark green indicates a greater than 5% gain.
As you can see, there's only one sector that survived February - the Energy stocks. Our PerfChart tool brings that fact into even sharper focus:
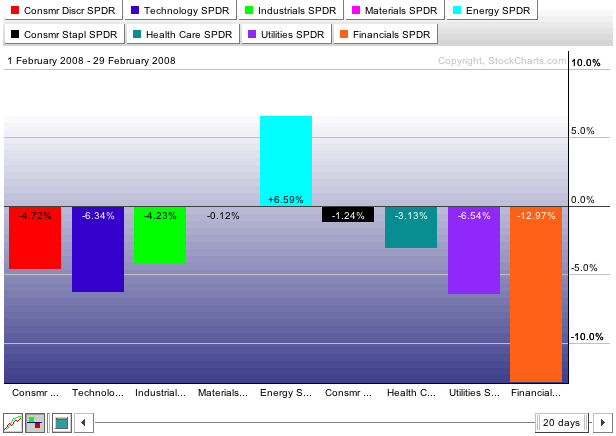
Keep these two great tools in mind as you follow the upcoming twists and turns in the markets. They should keep you out of trouble.
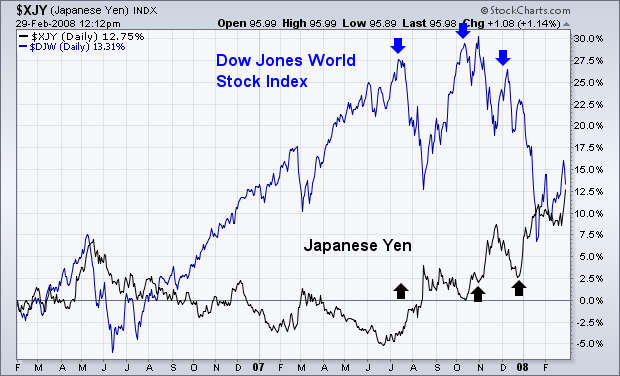
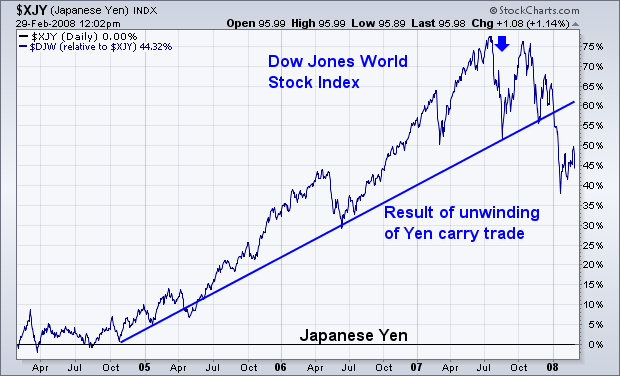
I first started writing about the danger posed to global stocks last summer when the yen first started rising. I also wrote that was because a rising yen was part of the unwinding of the so-called "yen carry trade". Over the last few years, global traders had been borrowing yen at almost no interest charge (shorting the yen) and using those funds to buy higher-yielding assets elsewhere including currencies and stocks. For awhile, it almost seemed like the global rally in stocks was predicated on the yen staying down and providing a continuing supply of cheap global liquidity. That all started to change last summer. Chart 1 shows a generally inverse relationship over the last two years between the Dow Jones World Stock Index (blue line) and the yen (black line). Note that every blip in the yen since the start of 2006 coincided with a market pullback. Last summer, however, the yen turned up in a more serious way. The upturn in the yen during July coincided exactly with the start of the topping process in global stock markets. Each subsequent yen upturn (November and December) coincided with another stock peak. That certainly suggests that yen strength is contributing to global stock weakness. That's because traders are now being forced to buy back yen shorts and sell assets elsewhere. Chart 2 shows the impact of the rising yen even more dramatically. That chart compares global stocks (blue line) to the yen (plotted as the black zero line). The blue line is in effect a global stock/yen ratio. It shows that a rising yen has been a bad thing for stocks. And there's no sign of that negative trend ending. At the risk of a bad pun, Chart 2 shows that a stronger yen has stopped "carrying" the bull market in stocks.
The Transport iShares (IYT) is an ETF designed to match the performance of the Dow Jones Transportation Average. The key industry groups include airlines, railroads, truckers and air freight, all of which are quite sensitive to the overall economy.
After surging in January, the ETF met stiff resistance in February and this week's decline looks like the start of another leg lower. Resistance stems from the 200-day moving average and the reaction highs from late August to mid December. The ETF surged to this zone, stalled and then backed off with a vengeance the last three days.
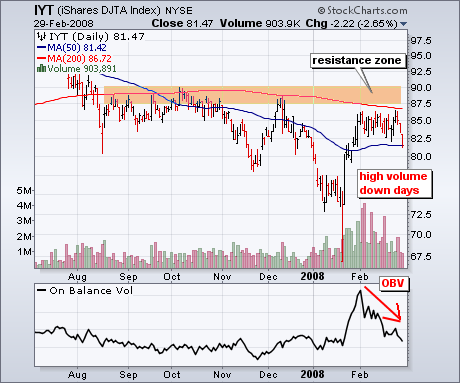
In addition to a failure at resistance, a key volume indicator shows signs of distribution and increased selling pressure. On Balance Volume (OBV) peaked on 1-Feb and declined the last four weeks. Even while the ETF traded flat, OBV was already moving lower. The long red volume bars show high-volume selling that preceded this breakout.
All mechanical models have weaknesses, and our Thrust/Trend Model is no exception â it is vulnerable to whipsaw. Whipsaw occurs when the market moves just enough in one direction to trip the signal triggers in the model, then it reverses direction and moves just far enough to trigger a reverse signal. This results in a loss on the previous signal. This has happened a number of times in the last several months.
Our model is designed to capture intermediate-term trends and to ride out the zigzag movements and minor corrections that occur as the market trends up or down; however, when the market is in the process of forming a top or bottom, the associated chop can be sufficient to whipsaw the model a lot. Also, bear market rallies can be quite violent and often exceed normal expectations, so whipsaw is quite common then.
Looking at the chart below, you can clearly see the numerous 20/50-EMA crossovers that have occurred in the last year, something that would not happen if the market were in a solid trend. More important, let's look at what is probably the most recent whipsaw.
The Thrust/Trend Model (T/TM) generates a buy signal any time the PMO (Price Momentum Oscillator) and the PBI (Percent Buy Index) have both crossed up through their moving averages. This is a relatively short-term event, and the signal should be considered short-term until the 20-EMA of price crosses up through the 50-EMA. This action confirms or "locks in" the buy signal, and the PMO and PBI become irrelevant. Next a sell or neutral signal would be generated when the 20-EMA crosses back down through the 50-EMA.
Getting back to the current buy signal, notice that I have marked with green arrows the moving average crossovers that generated it. At this point, it is highly likely that this signal will prove to be a fakeout, because the 20-EMA is a long way from managing an upside crossover of the 50-EMA. The next most likely event will probably be the PMO or PBI crossing down through a moving average, which will generate a sell signal.
It is important to remember that T/TM buy signals, particularly in a bear market, are short-term events, and discretionary decisions are necessary to avoid the losses whipsaw can cause. How do we know we are in a bear market? Again, when the 50-EMA crosses down through the 200-EMA on the daily chart, we assume a bear market is in force. On the next chart, a weekly-based chart of the S&P 500 Index, we use the 17/43-EMA crossover as a bear market signal. Clearly, the total picture on this chart is pretty grim.
Bottom Line: Oversold market conditions and a fair amount of manipulation from the sidelines has not been sufficient to move the market out of the consolidation range of the last several weeks. This should not be a surprise because we are in a bear market, and in a bear market we should expect negative outcomes.
As the credit crisis continues to unfold in rather negative fashion; many believe that the US economy will not enter into a recession, and many believe that if we do enter into a recession - that it is likely to be short-lived and shallow. We'd beg to differ as this will not be a "V" shaped recovery as most hope for, but more of the "U" variety that few fear...more long and drawn out. Demand for credit is high; availability of credit is low.
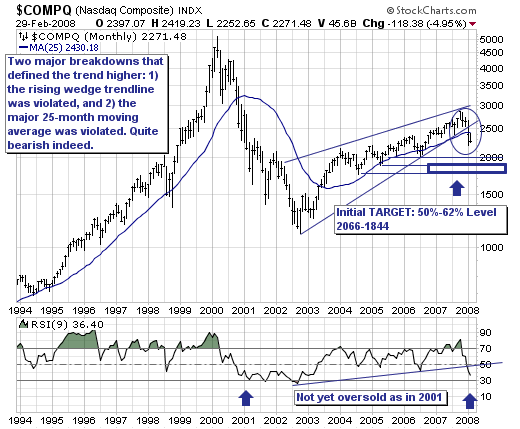
But our concern aside, the US equity markets have clearly entered into a bear market. Today, one should look at the monthly NASDAQ Composite chart to see that the defining technical indicators for the bull market off the 2002 lows have been violated. To keep it rather simple, for simple is best - rising trendline support of the rising wedge was violated. We all know from Technical Analysis 101 that monthly trendline breakdowns carry more weight. Also, the major trend defining 25-month moving average was violated - which in tandem with the trendline violation - argues strongly for sharply lower prices.
Therefore, rallies are to be sold, which given current prices are only but 161 points below the 25-month moving average - suggests this bear market is about to accelerate. And, we won't see it end until the current complacent 'public' hits the much vaunted "puke point." Where that point is will be debated for a number of months; but perhaps the 50%-62% retracement zone at 1844-2066 will offer at least an initial bottoming target prior to what is likely a sharp short covering rally. For now, all that really matters is that the trend lower; and as such...we are sellers of Technology, Consumer Discretionary and Retail shares.