Hello Fellow ChartWatchers!
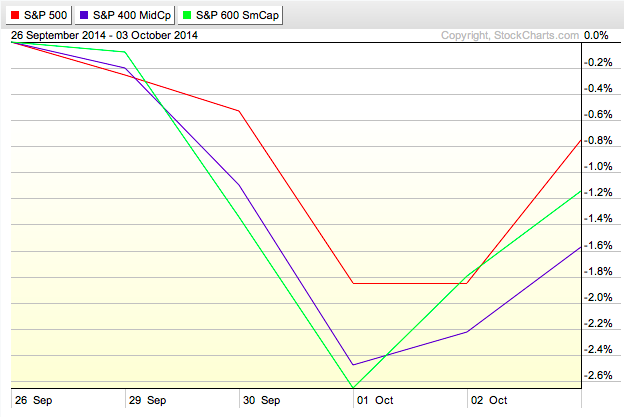
It was definitely a roller coaster ride for stocks this week. The bears were firmly in control on Wednesday but then the Bulls roared back Friday on the strength of the US Employment numbers. A quick glance at the Market Cap PerfChart shows that Large Caps were the big "winner" last week while Mid-Caps lost twice as much.
All this squabbling shows up clearly on the broader index charts as well. Have you checked out the charts in Arthur Hill’s free “Market in a Nutshell” ChartPack recently?
Side Note: A ChartPack is a pre-created collection of SharpCharts and ChartLists that StockCharts Extra members can install with just a couple of clicks. Last year, our Senior Technical Analyst, Arthur Hill, created a free ChartPack called “Market in a Nutshell.” It’s a collection of 10 very useful charts that Arthur reviews every day. If you are member of our Extra (or PRO) service, you can install the ChartPack by clicking on the “Your Account” link in the upper right corner of the page and then scrolling down to the “ChartPacks” area. For more on installing and using ChartPacks, click here.
OK – sorry about that – here is one of the more interesting charts from Arthur’s collection:
(Click the chart for a live version)
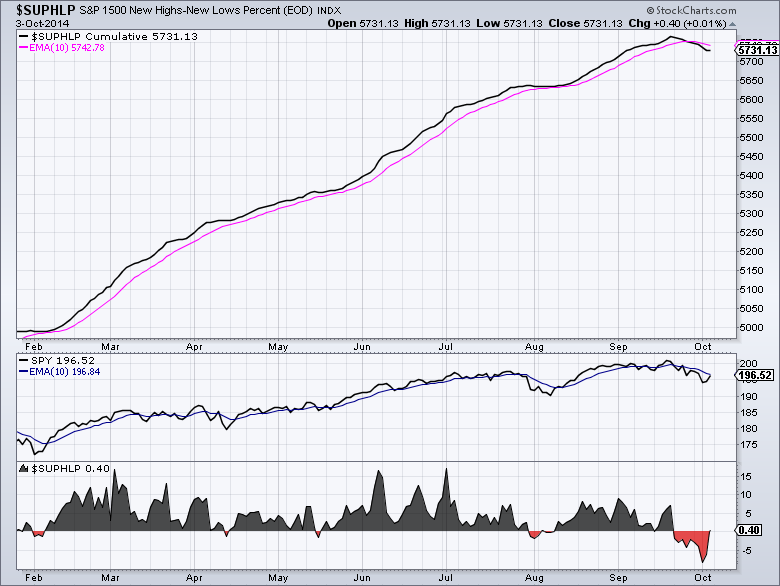
This is a slightly modified version of Arthur's first chart - the S&P 1500 High-Low Line (I just shrunk it a little bit so it fits into the newsletter format). Back on September 26th, this broad market indicator - one that very few people watch closely - gave a clear bearish signal confirming the red signal given by the non-cummulative version ($SUPHLP) several days earlier. Since that is based on 1500 important stocks from all different market-cap categories, it is definitely a signal worth watching.
Again, ChartPacks are a great resource for StockCharts members, but if you are like most people, you have to remember to use them after you install them!
Greg Schnell’s Thursday Webinars
The other big news from past two weeks is that we held two very successful webinars with Greg Schnell presenting. We are continuing to explore the possibly ways that webinars can help our users. Last Thursday, over 500 people attended Greg’s webinar and the feedback was overwhelmingly positive. Based on that, we have tentatively scheduled additional webinars by Greg on every Thursday in October.
Each Thursday at 4:30pm Eastern (30 minutes after the markets close), we’ll hold a one hour live session with Greg. The webinar format allows you to see Greg’s screen and hear his voice as he walks you through his charts. He’ll cover his currently thoughts on the markets and then demonstrate how to use various features of StockCharts.com. We also leave time at the end of the session for live Q&A.
If you have the bandwidth, you can click here to review last week’s webinar.
If you are interested in attending this Thursday’s upcoming webinar, first click here and follow the instructions for installing and testing the webinar software. Make sure you use all the resources on that page to get the webinar software working smoothly otherwise you’ll just be frustrated when the webinar starts.
After you have verified that everything works, you can click here to register for our next webinar. Greg and I are looking forward to seeing you in the (virtual) audience.
Look for us to expand our use of webinars soon. As we improve things, we’ll be inviting Arthur Hill, John Murphy, Erin Heim, Tom Bowley, and others to join in the fun. Stay tuned…
- Chip
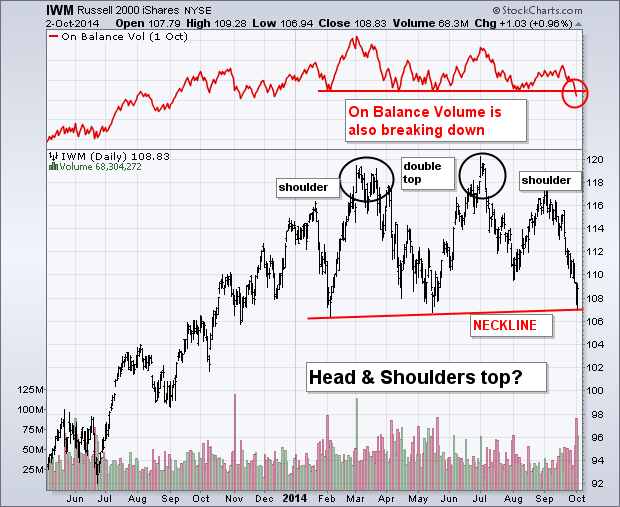
A debate is going on within the technical community as to whether or not the Russell 2000 Small Cap Index is in danger of completing a "head and shoulders top". A case can certainly made for it, although it would be an unusual one. The daily bars in Chart 1 show Russell 2000 iShares forming two smaller peaks (shoulders) during January and late August. In between those two lower "shoulders" a "double top" was formed between March and early July. While it might not qualify as a textbook "H&S" top, the bearish warning is still valid. At the moment, the Russell 2000 iShares (IWM) are testing a "neckline" drawn under its February/May lows (red line). A downside violation would complete the topping pattern that's been forming for months. The negative volume pattern confirms that bearish warning. The volume bars along the bottom of the chart show heavier trading during selloffs and lighter volume on rallies. This week's downside volume has been particularly heavy. The red line on top of Chart 1 is On Balance Volume (OBV) which is a running cumulative total of upside versus downside volume. It's also in danger of breaking its own support line. [A 1% bounce today kept the IWM above neckline support].
The S&P 500 SPDR (SPY) appears to be putting in another higher low that could signal the resumption of the long-term uptrend. First and foremost the long-term trend is up because SPY recorded a 52-week high less than three weeks ago. In addition, the charts shows a clear progression of rising peaks and rising troughs. Under this assumption, declines are viewed as corrections within the long-term uptrend. A reversal of this decline would end the correction and argue for a move to new highs.
The chart below shows the ETF becoming oversold as CCI moved below -200 for the third time in seven months. Oversold is a condition and this tells us to be on alert for a reversal. In addition, the ETF was near the 61.8% retracement, which is a Fibonacci number that can sometimes mark reversal areas. Thus, the combination of oversold and the Fibonacci retracement were enough to put traders on alert for a reversal.
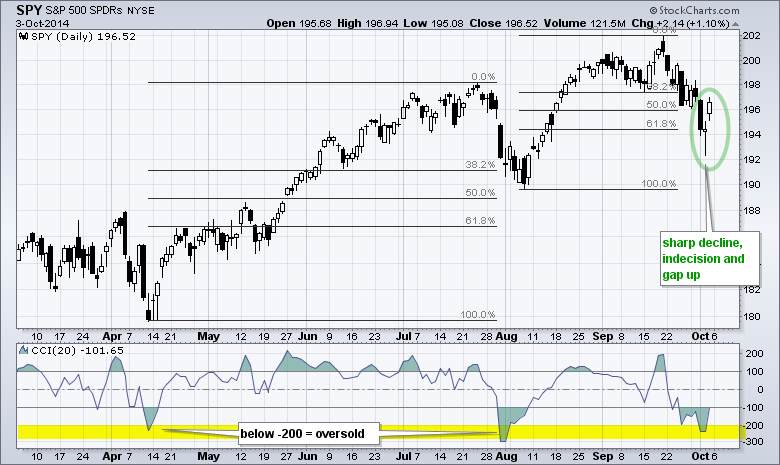
The first signs of a reversal are now apparent with the candlesticks over the last three days. The first is a long filled candlestick that shows strong selling pressure. The second is an indecisive candlestick with a spike low near 192. This candlestick also reflects an intraday reversal as SPY dipped to 192.35 during the day and rallied to close at 194.38. The third candlestick completes the reversal with a gap and close above 196. This candlestick sequence is similar to a morning doji star. At this point, it is important that the gap holds. After all, a strong and valid reversal should not look back. A move below 194, therefore, would show weakness and warrant a reassessment.
Good trading and good weekend!
Arthur Hill CMT
I have been very interested to watch the Japanese Equity Market ($NIKK) to see if it can hold the breakout from the 25 year trend line. First of all, here is a long chart.
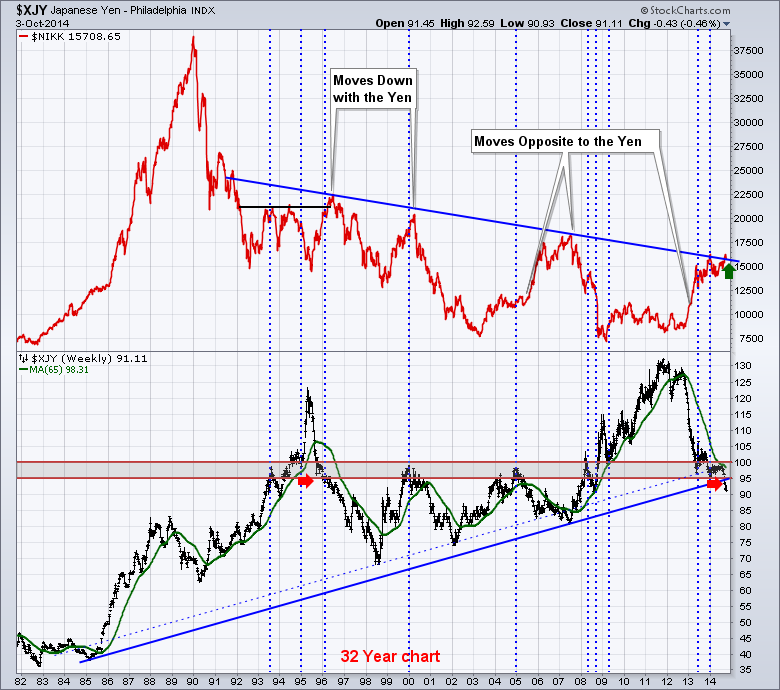
Why does this matter? When a long trend line breaks it is usually very important. Lets zoom in on the last year:
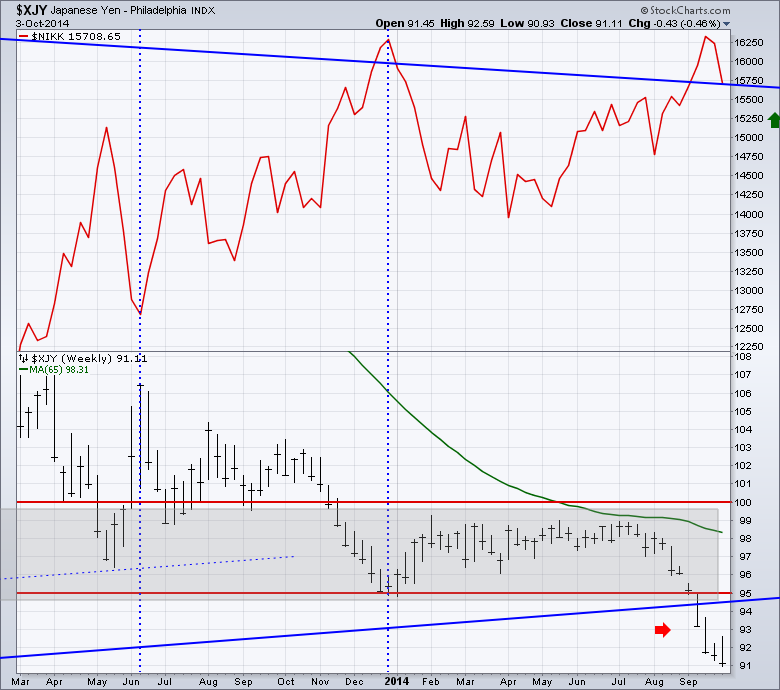
If this breakout fails, it usually will be a meaningful plunge down instead. We can see it closed back at the trend line on Friday. If the $NIKK can break out it will be powerful. The fact that the Yen closed near the lows but was an outside day is interesting. If the Yen started to rally against the $USD, we would probably see the $NIKK pull back. Time to watch closely as the volatility is picking up on the $NIKK with a big 400 point down day this week. This trade could be traded through any of the Japanese ETF's and preferably the hedged ETF's so the currency exchange does not wipe out your profit.
Thursday's Webinar -
I had a great time last Thursday during our 4:30pm Webinar. We had some great questions from the audience. If you weren't able to make it (and you have the bandwidth), you can click here to see a replay.
Good trading,
Greg Schnell, CMT
The Fed is winding down its asset purchase program and the historically weak month of September is now behind us. So what's in store next? Earnings season. The stock market sends us signals all the time and given the recent performance of certain sectors and industry groups, we can surmise where to look for positive earnings surprises. One of the best looking areas of the market technically right now is investment services ($DJUSSB). Off the early August lows, the DJUSSB rose sharply (approximately 13%) over the next 6-7 weeks. During this same period, the S&P 500 rose about 5%. The relative strength in investment services has been trending higher since 2012 as can be seen in the chart below:
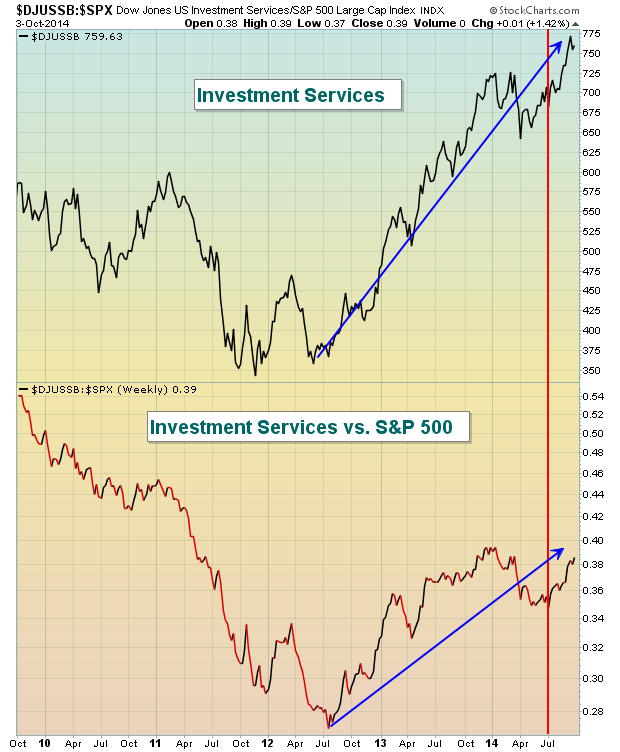
The red vertical line also shows how strongly this industry has performed over the past few months leading up to this earnings season. That tells me we're likely to see some excellent quarterly results from companies within this space.
Railroads ($DJUSRR) have also been a shining star - not just over the past couple months, but throughout 2014. There are going to be very high expectations for earnings within this transportation group for sure. Check out the relative outperformance here:
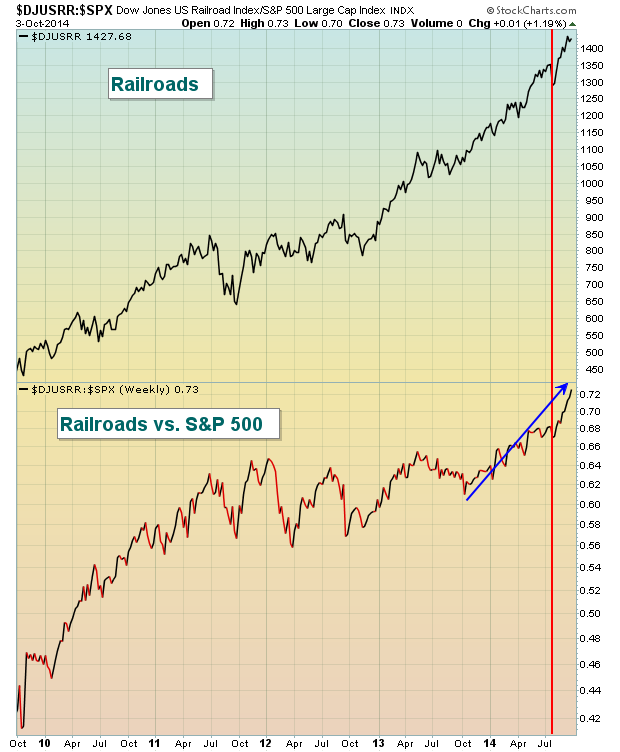
I also placed a red vertical line on this chart that shows the strong relative strength of railroads over the past couple months leading up to Q3 earnings reports.
On Thursday, October 9th, I will be hosting a FREE webinar discussing the best ways to trade gaps resulting from earnings reports, among other topics. With earnings season just around the corner, this will be quite timely. For more information, simply CLICK HERE.
Happy trading!
Tom Bowley
Chief Market Strategist/Chief Equities Strategist
Invested Central/EarningsBeats.com


 The latest wave on Wall Street's beach of complexity and opaqueness is a new type of ETF fund referred to as a Smart Beta Fund. I've even heard these new funds referred to as Bionic Beta Funds. Consider this a case-in-point and follow-up to my blog last week where I ranted against Wall Street's purposeful complexity. It's no longer a case of passive (index) funds versus active managed...