PASSING THE TORCH
by Chip Anderson | ChartWatchers
Hello Fellow ChartWatchers!
Well, after 18 years of writing these newsletters - and doing webinars and hosting conferences and writing educational articles - I am reliquishing those duties to others so that I can focus (re-focus?) on my real passion - making the technology behind StockCharts.com really great.
Last week's ChartCon event - which was amazing and went off with almost zero glitches - marked a milestone in my development as a writer/educator. It feels like I've said most of what I needed to say and that continuing forward in that space would just involve lots of repetition. In addition, there are many, many behind-the-scenes technical things here that haven't gotten the attention they deserve and it is pretty clear that the only way that's going to happen is for me to focus on those things full time.
So, from a practical perspective, I will be handing over the reins of this newsletter and its corresponding webinar to Grayson Roze. Watch for great things from Grayson in the coming weeks. We will also be re-packaging some of my better articles into a "greatest hits" series that can help you continue to get the most out of StockCharts.com. Finally, I am challenging the other commentators here to up their game and include even more educational "how to's" and "step-by-step" help in their articles and webinars.
Pretty much everything I've said over the years boils down to a couple of key points:
- Keep it simple - narrow your focus. John Murphy uses 4 indicators, why do you need 37?
- Focus on Momentum (MACD) and Relative Strength (SCTRs). They are easy to understand, easy to use and work great.
- Reject any kind of "get rich quick" approach. Learning to trade successfully takes time and patience.
- "Why" doesn't matter. Focus on what the charts are saying. Find trends and ride them until they weaken. Forget about why.
- Focus on "actionable information" and reject anything that leads to analysis paralysis. Always ask yourself "Will this information cause me to make any changes?"
Hopefully you got a chance to see me expand on these ideas in my ChartCon talk.
Moving forward - John, Martin, Arthur, Tom, Greg #1, Greg #2, Julius, Erin, Bruce, Gatis, Grayson and all of our other commentators will give you lots of great articles to read for the foreseeable future. And I'll be in the background, coding up a host of new tools and capabilities that will make StockCharts.com even better.
Take care,
- Chip
Once again, transportation stocks appear to be on the verge of a bullish breakout. Chart 1 shows Transportation Average iShares (IYT) on the verge of breaking through their April/September highs. Their relative strength ratio (top of chart) also appears to have bottomed. I recently showed buying in airlines and air freight. Rails, however, have been the strongest part of the transportation group and are leading it higher today. As I showed yesterday, transports are now outperforming utilities which is a positive sign. A transportation breakout would be another good sign for the market and the economy.
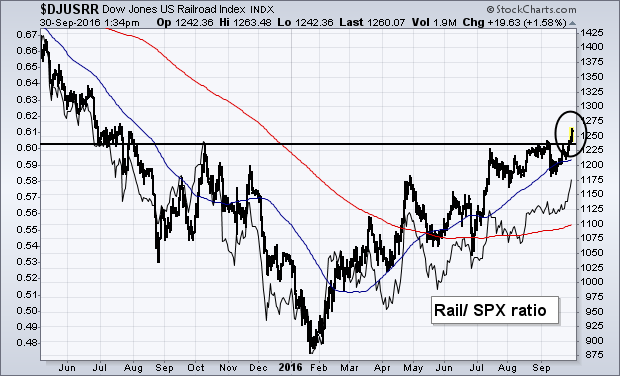
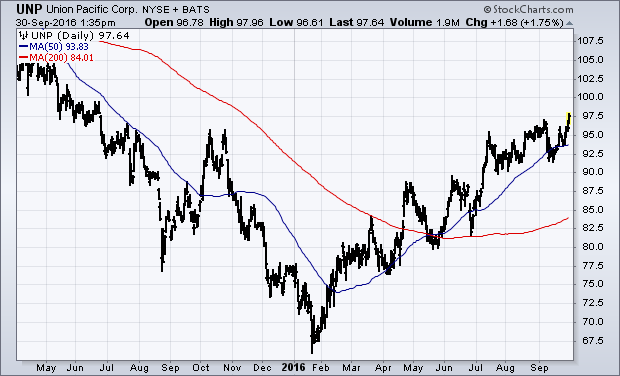
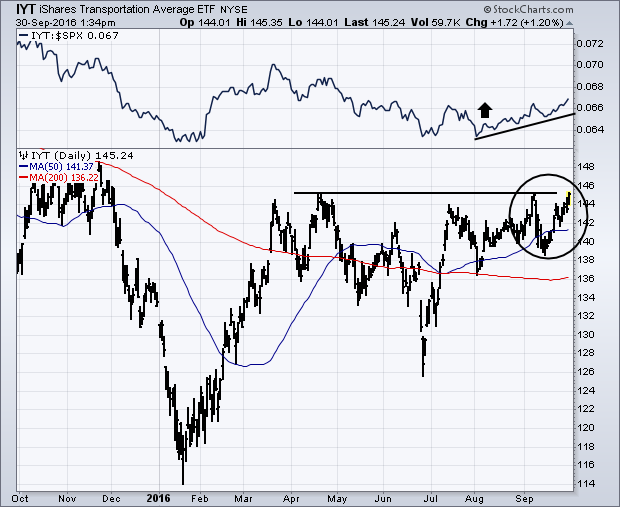 Chart 2 shows the Dow Jones US Railroad Index ($DJUSRR) rising above its October peak to establish a new uptrend. It's relative strength (solid) line is rising as well. Its 50-day average cleared its 200-day in May. One of the premises of Dow Theory is that transportation stocks should rise with the industrials. Industrials make the goods while transports (like rails) move them to market. The economy (and the market) are stronger when both are moving up together. The rails have already turned up. The entire transportation group is on the verge of doing the same. Chart 3 shows Union Pacific (UNP) also in an uptrend. CSX (not shown) looks the same. Norfolk Southern (NSC) isn't far behind.
Deutsche Bank dominated the news late in the week, but US banks have been largely unaffected and bullish flags are taking shape in two bank-related ETFs. The charts below show the Bank SPDR (KBE) and the Regional Bank SPDR (KRE) in long-term uptrends. Notice that the 50-day EMAs are above the 200-day EMAs and both ETFs hit their highest levels of the year in late August. Both ETFs pulled back in September, but I view short-term pullbacks as opportunities when the bigger trend is up.
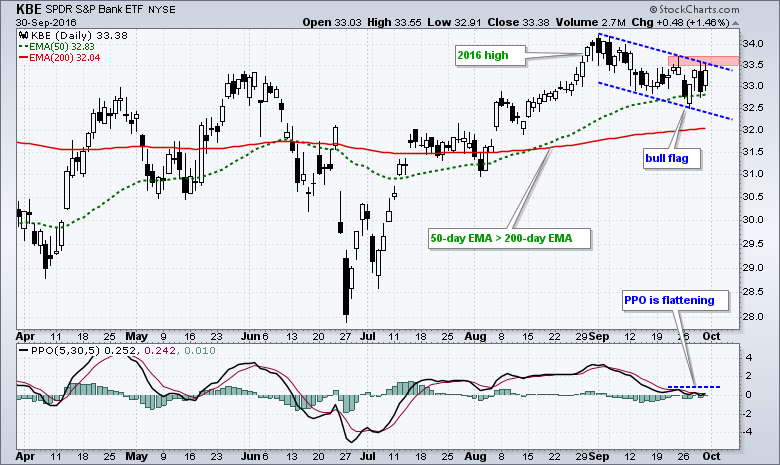
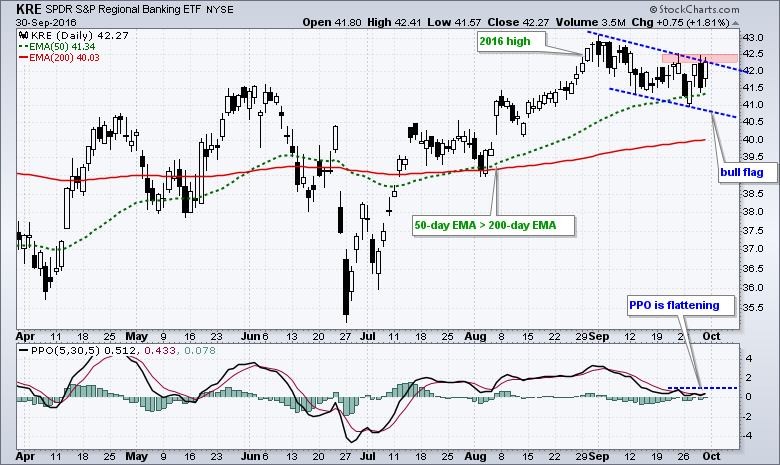 The ETFs pulled back after the August surge and these pullbacks look like bull flags. Note that bullish flags slope down and mark corrections within an uptrend. A move above the late September highs would break flag resistance and signal an end to the correction. This would also signal a resumption of the bigger uptrend. Chartists can also watch the Percentage Price Oscillators (PPOs) because they are flattening and could be poised for an upturn.
Follow me on Twitter @arthurhill - Keep up with my 140 character commentaries.
****************************************
Thanks for tuning in and have a good weekend!
--Arthur Hill CMT
Plan your Trade and Trade your Plan
*****************************************
While the world continues to debate the path of every pipeline, investors are not debating the path of the pipeline companies.
Three of the larger pipeline companies are in focus this week as another LNG project on the west coast was approved in Canada. One of the major pivot points on these approvals is that the pipelines required to feed them would also need to be approved.
With three majors working on access to get Crude Oil and Natural Gas products to tidal water for exporting, it is timely to look at the stocks.
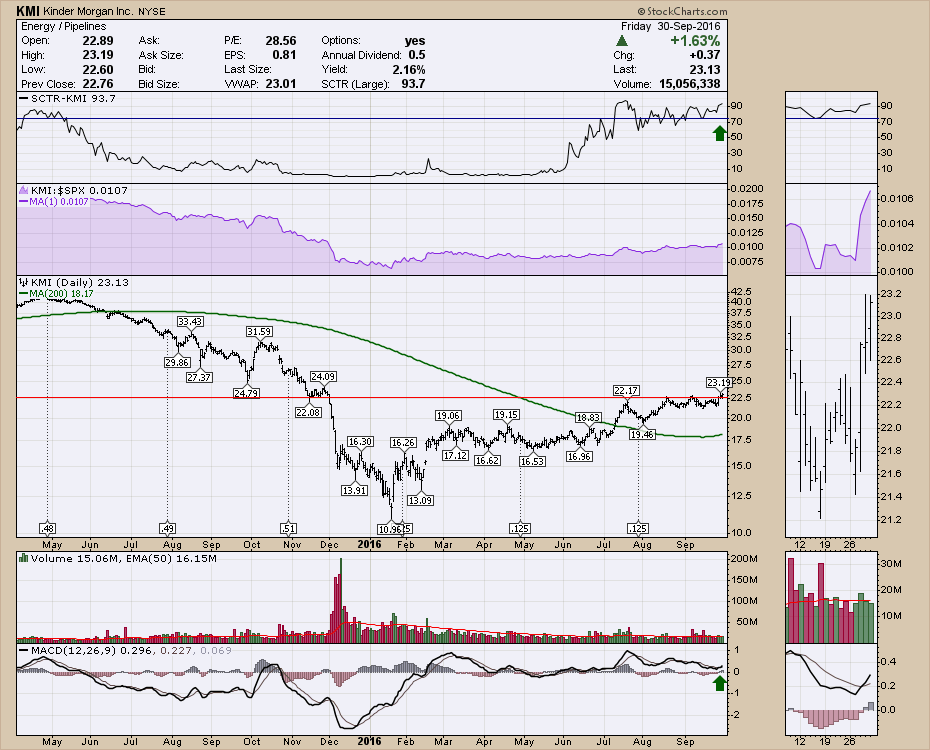
Kinder Morgan (KMI) made new 9-month closing highs on Friday.
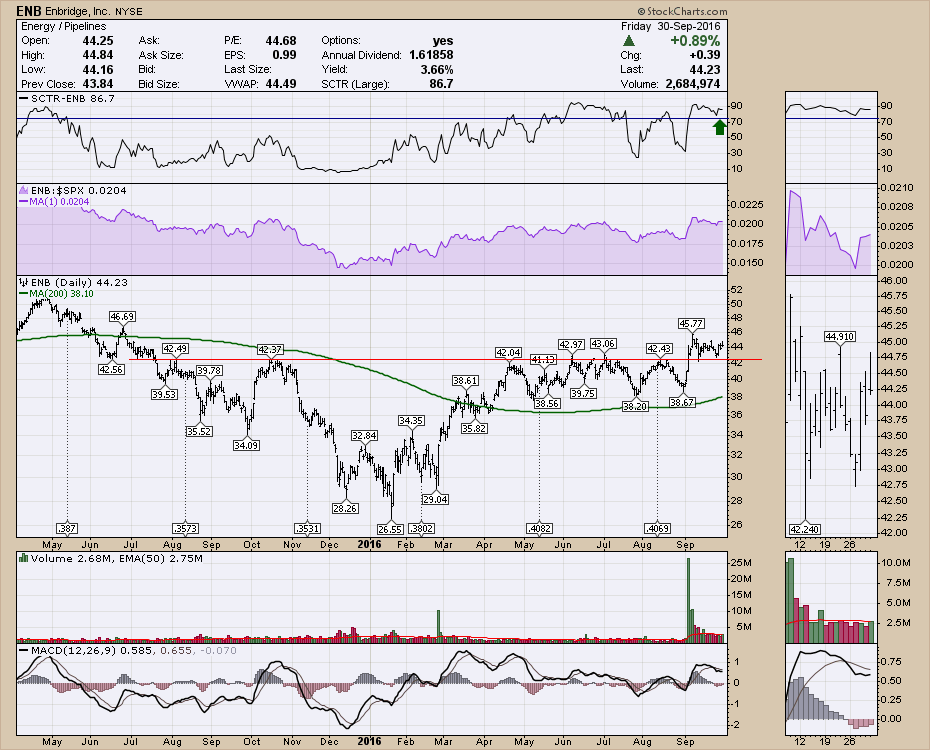
Enbridge (ENB) recently made a big bid for Spectra Energy. The investing community seems to really like it. The stock has been consolidating since the big surge in price and volume.
 TransCanada (TRP) is also pushing to fresh highs.
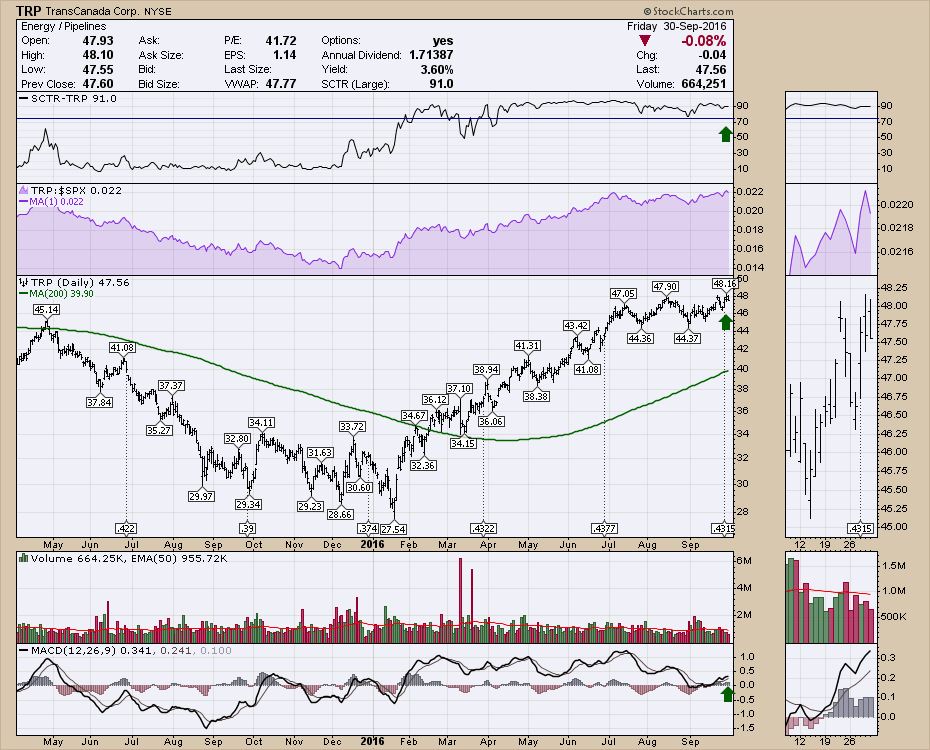 This industry group continues to be strong with nice dividend streams as well.
Good trading,
Greg Schnell, CMT, MFTA.
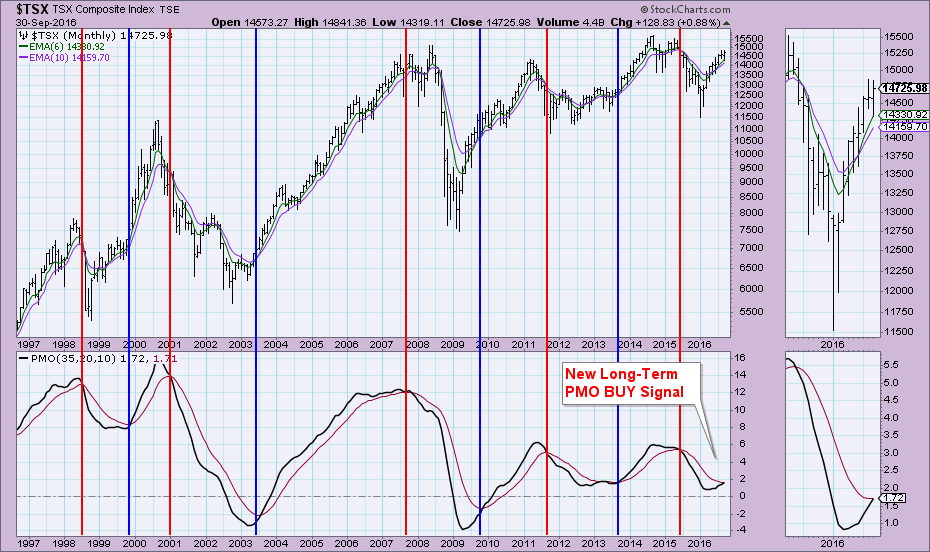
Hopefully I won't be stepping on Greg Schnell's Canadian toes, but as I was going through charts from last Wednesday's webinar, I saw that $TSX just had a new LONG-TERM Price Momentum Oscillator (PMO) BUY Signal. These are incredibly infrequent; for the last twenty years, we've only had nine long-term PMO crossover signals...that's BUY and SELL signals combined.
I've annotated in the chart below with red vertical lines at PMO SELL signals and blue vertical lines for PMO BUY signals. Today's BUY signal is very promising when you review the weekly and daily charts as well.
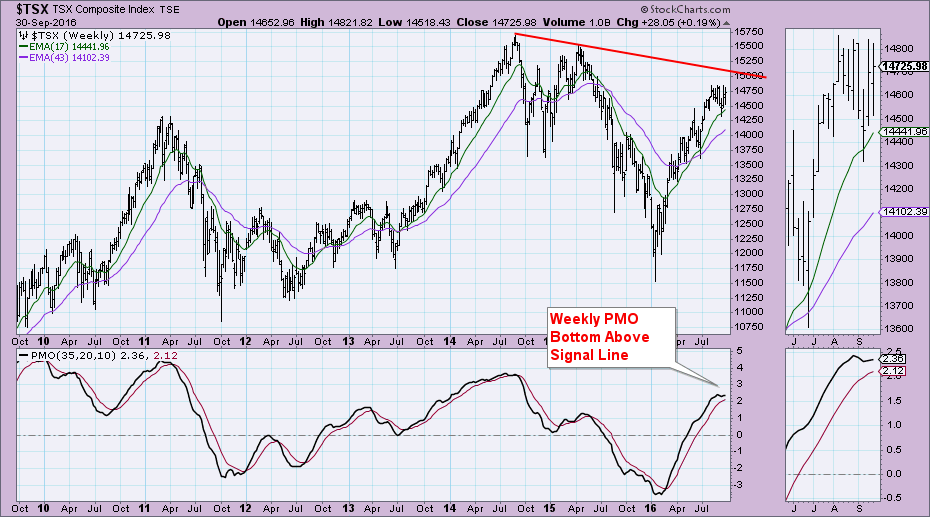
All-time highs are very far away. I'm not suggesting that this long-term PMO BUY signal is implying a move to all-time highs next month, but the bearish bias in the long term is falling away. Notice on the weekly chart below that the PMO has turned up above its signal line which is very bullish. It's somewhat overbought, but the weekly (and monthly) PMOs move slowly. There is also more territory above current readings to accommodate more upside.
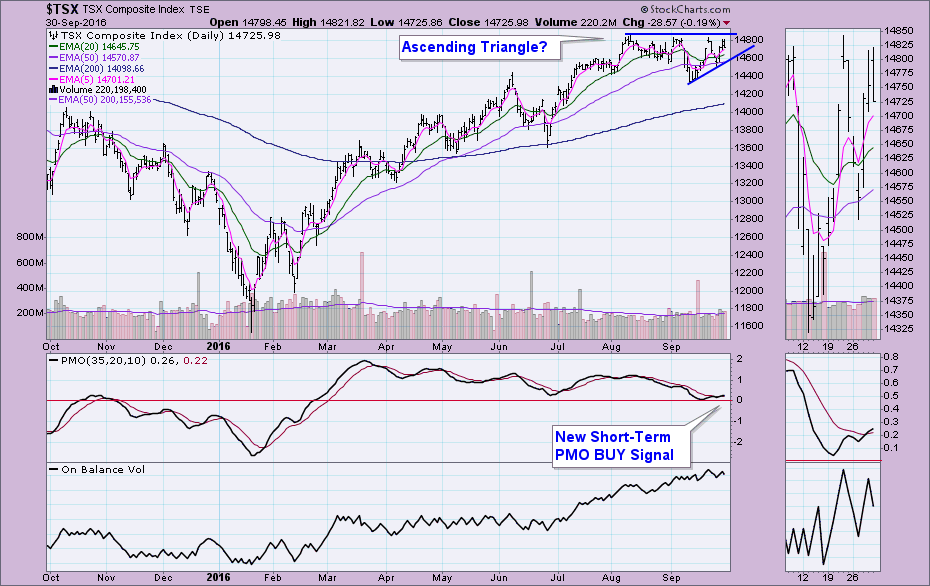
The daily chart suggests a breakout isn't out of the question. The PMO just generated a new PMO BUY signal on the daily chart. I'm also seeing a fairly "textbook" ascending triangle. The pattern suggests an upside breakout.
Conclusion: There are many fundamental forces at work behind the scenes that could sabotage $TSX, but technically speaking it's looking quite bullish in all three timeframes.
Come check out the DecisionPoint Report with Erin Heim on Wednesdays and Fridays at 7:00p EST, a fast-paced 30-minute review of the current markets mid-week and week-end. The archives and registration links are on the Homepage under “Webinars”.
Technical Analysis is a windsock, not a crystal ball.
Happy Charting!
- Erin
Technology stocks (XLK) produced gains of more than 10% in the third quarter of 2016, more than double that of any other sector. Industrials (XLI) were the second best group, posting a quarterly gain of 4.80%. We all know the bigger names in technology, so this article will focus on other names in key technology industry groups that perhaps you haven't been paying attention to. Let's start with computer hardware ($DJUSCR).
Computer Hardware
Of course Apple (AAPL) is the stock that everyone watches in this space and rightfully so. It's been among the best performing technology stock for decades so why wouldn't we watch it closely? But instead of AAPL, let's focus on the strengthening technical indications of Network Appliance (NTAP). Here's the chart:
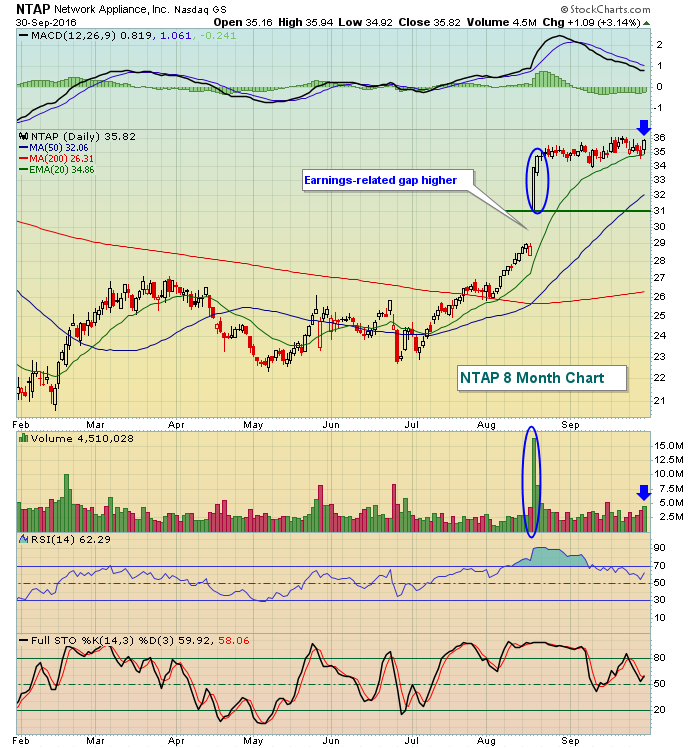 The market's reaction to NTAP's last earnings report was very impressive. It began with maribozu candle, which means that NTAP opened on its low of the day and closed on its high, producing a very bullish hollow candle. Despite the imbalance of orders at the open, putting market makers on the short side, NTAP continued surging higher - very bullish indeed as signs of accumulation were apparent. Friday's action suggests the uptrend could be on the verge of resuming as volume accelerated and NTAP neared another breakout. Finally, that earnings surprise broke a 20 month downtrend line dating back to late 2014. I expect we'll see more positive news out of NTAP in the 4th quarter. Why? Well, for starters, NTAP has averaged gaining 8.7% over the past 20 years. It's hard to ignore that fact with technical conditions rapidly improving.
Semiconductors
Ok, we've all heard of Intel (INTC), which rose approximately 16% in the 3rd quarter, and Advanced Micro Devices (AMD), a competitor of INTC that rose a staggering 34% in the past three months, but have you heard of FormFactor (FORM)? There were a number of semiconductor stocks ($DJUSSC) to choose from but FORM posted solid quarterly results that topped Wall Street's revenue and EPS estimates and subsequently broke out to highs not seen since early 2011. Check out the improving technical picture:
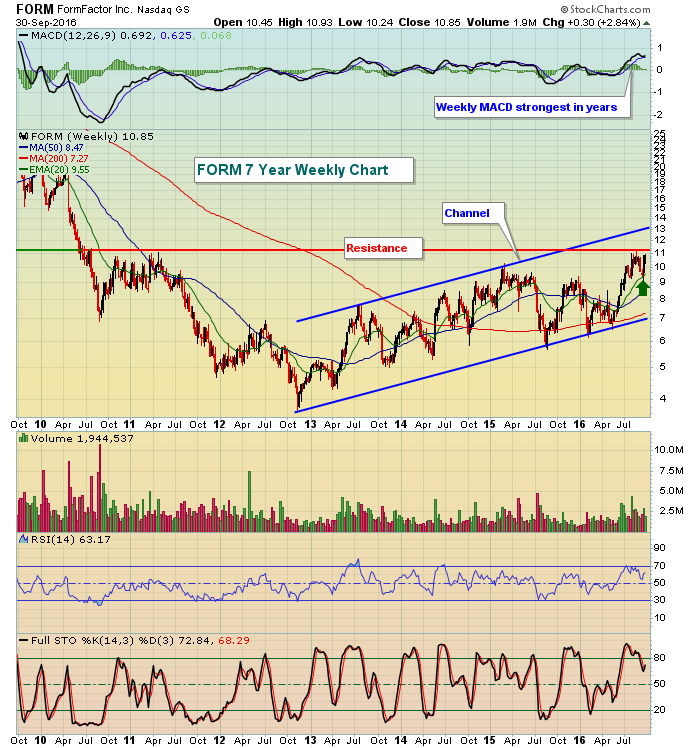 The 11.00 area has been a wall of resistance since FORM's attempt to break through this level in early 2011. A breakout above could result in a parabolic rise because FORM completely fell apart prior to breaking below 11.00 back in the first half of 2010 - on massive volume. It's not unusual to see mirror images on charts so a very quick pop - 50% or more - shouldn't be ruled out during the 4th quarter. One final note: Despite its overall mediocrity during much of this bull market, FORM has produced impressive 4th quarter gains during its current four year channel higher.
Internet
I have posted on many occasions that internet stocks ($DJUSNS) absolutely love the period from September 1 through December 31. Over the past 20 years, every calendar month during the period - September, October, November and December - has risen more than 70% of the time and their average monthly gains have been 4.1%, 10.7%, 1.5% and 2.0%, respectively. That's a lot of gains. So am I surprised that the DJUSNS just posted a gain of nearly 2% in September to help lead technology higher? Not at all. We all know about Alphabet (GOOGL), Facebook (FB) and Baidu (BIDU), which all posted solid quarterly gains between 10-15%, but are you familiar with Carbonite (CARB), which just racked up 58% gains in the last quarter? I'm normally not too excited to chase companies that have posted recent results like this, but the technical picture is improving and a key long-term post-IPO resistance level is approaching as you can see below:
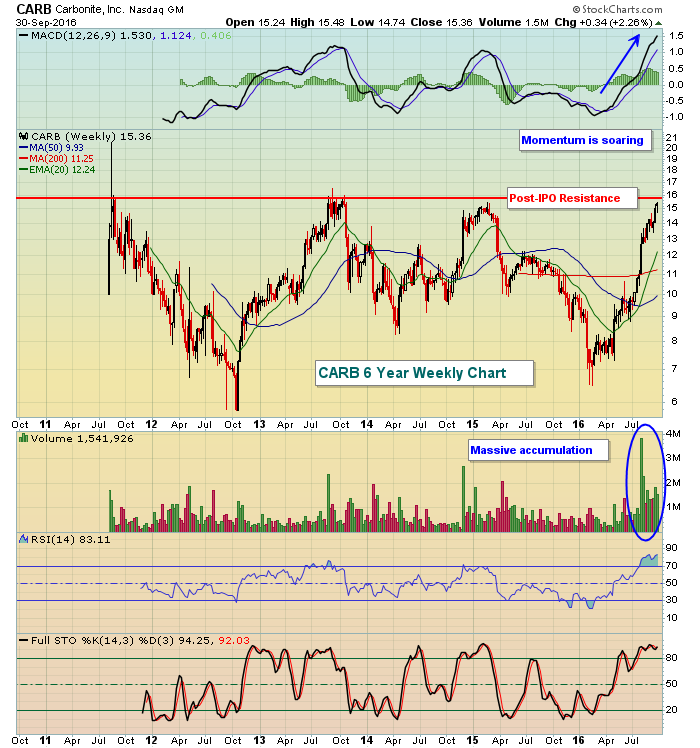 They say a picture can paint a thousand words. Well, in CARB's case, 999 of them are bullish. The only downside to this chart is that CARB is extremely overbought. Should we get a pullback at some point to get closer to that rising 20 week EMA, it'd be difficult to ignore the potential here - especially for those who maintain a higher risk tolerance level. The most impressive part of this chart - besides the price gains obviously - is the massive volume that suggests consolidation. CARB has never had a weekly close above the 15.75-16.00 area. Such a move would likely generate more technical buying interest so keep an eye on this one as we enter a period that is historically very bullish for internet stocks.
Happy trading!
Tom
TIS THE SEASON - EARNINGS SEASON
by John Hopkins | InvestEd Central
The third quarter has come to an end. It ended on a high note with the S&P gaining 3.3% from the June 30 close to Friday's close. Interestingly, the S&P got to 2168 two weeks into the third quarter which is exactly where it ended on Friday. In other words, if you had gone into a long slumber on July 14 and woke up on September 30, you wouldn't have missed a thing.
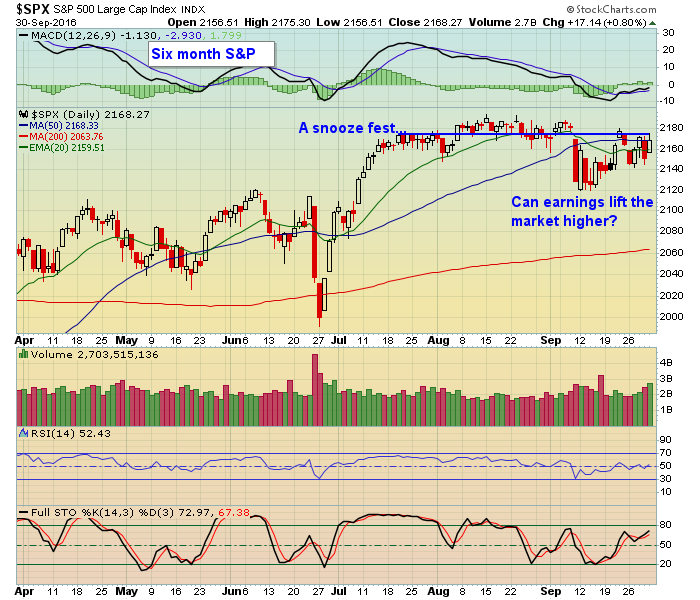 Of course there's no telling how the market will perform between now and the end of October when a good portion of earnings will be reported. But in looking back over the past five years, from September 30 to October 31, here's the results:
2011 - +3.6%
2012 - (-1.9%)
2013 - +4.4%
2014 - +2.3%
2015 - +8.2%
2016 - ???
You can see above that four of the past five years have produced positive results between September 30 and October 31. In fact, last year saw a substantial increase of over 8%.
Even though the S&P has been stuck near the same level for the past 2.5 months it still remains within easy striking range of its all time high. And the NASDAQ has shown particular resiliency as it remains above all key technical levels. This might indicate that traders feel earnings could be solid for the quarter.
The "official" start of earnings season will be October 10 when Alcoa reports its numbers after the bell. Then for the following three to four weeks thousands of companies will report their numbers. We'll be keeping track of those companies that beat earnings and have solid charts so we can provide them to our members as potential high reward to risk trades. If you would like to see a sample of our exclusive "Candidate Tracker" just click here.
At your service,
John Hopkins
EarningsBeats

Please refer to the charts of Charles Schwab (SCHW), PayPal (PYPL) and Morgan Stanley (MS/RA) that I presented to you in the
Action Practice #2 blog I wrote on September 16, 2016.
Read More

 Chart 2 shows the Dow Jones US Railroad Index ($DJUSRR) rising above its October peak to establish a new uptrend. It's relative strength (solid) line is rising as well. Its 50-day average cleared its 200-day in May. One of the premises of Dow Theory is that transportation stocks should rise with the industrials. Industrials make the goods while transports (like rails) move them to market. The economy (and the market) are stronger when both are moving up together. The rails have already turned up. The entire transportation group is on the verge of doing the same. Chart 3 shows Union Pacific (UNP) also in an uptrend. CSX (not shown) looks the same. Norfolk Southern (NSC) isn't far behind.


 The ETFs pulled back after the August surge and these pullbacks look like bull flags. Note that bullish flags slope down and mark corrections within an uptrend. A move above the late September highs would break flag resistance and signal an end to the correction. This would also signal a resumption of the bigger uptrend. Chartists can also watch the Percentage Price Oscillators (PPOs) because they are flattening and could be poised for an upturn.


 Of course there's no telling how the market will perform between now and the end of October when a good portion of earnings will be reported. But in looking back over the past five years, from September 30 to October 31, here's the results:
 Please refer to the charts of Charles Schwab (SCHW), PayPal (PYPL) and Morgan Stanley (MS/RA) that I presented to you in the