Let's continue on with the solar story. If you have not read the articles 1-4 published the week of December 8th-11th, I would recommend you do that. This will be continuing the story.
Jinkosolar Holdings (JKS) is next.
1) SPURS is declining. The node sticking out in September is quite different than the dotted line trend for the last three months. I would be happy to work with this stock if it breaks above the dotted line, especially if the rest of the industry group breaks out.
2) There is no SCTR for this stock. These rankings were derived mostly from S&P rankings of US stocks. Large cap , mid cap , small cap. This was not in those groups.
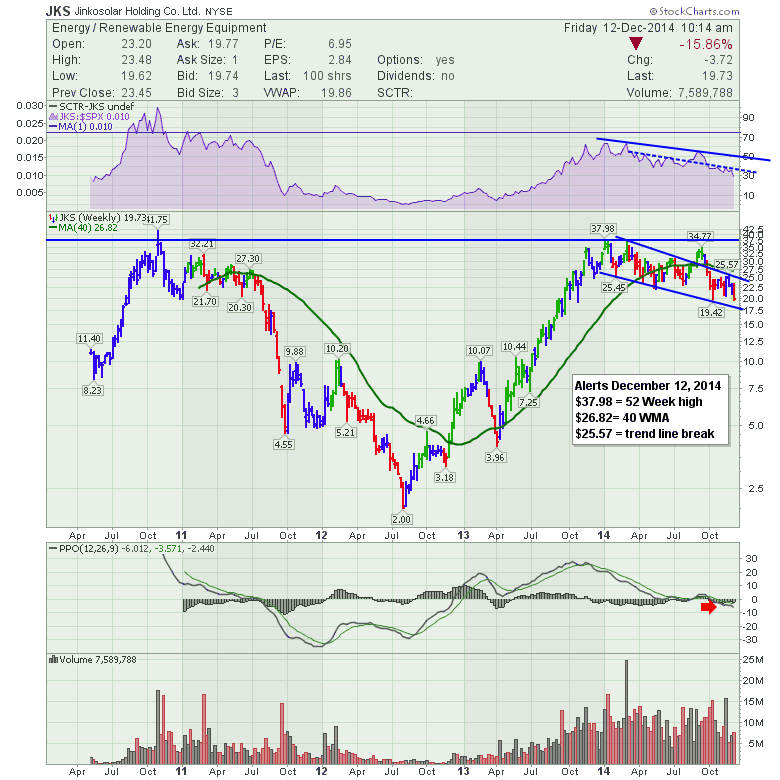
3) The price action is wild once again. Jinkosolar IPO'd after the financial crisis. However, after more than tripling, it pulled way back to $2. Then it rocketed up 1900% and stalled near the previous highs. Now it is halfway back! The stock continues to descend in a downward channel. The alert levels listed are a long way above. As an example the stock could rally 25% to get to our first alert. We can see the $20 level was support in the 2011 topping pattern. We are testing that level right now.
4) the PPO is slightly below zero and pointed down so now signs of encouragement on that indicator.
5) The volume is nice at 5 Million / week minimum.
Hi ho, off to the daily we go...
SPURS is in a big downtrend as we know. It looks like on the daily scale we could use either SPURS trend line for a reversal. Price action continues to step lower. The volume has been very light lately. No one is interested in buying so we want to look for a nice big buying candle.
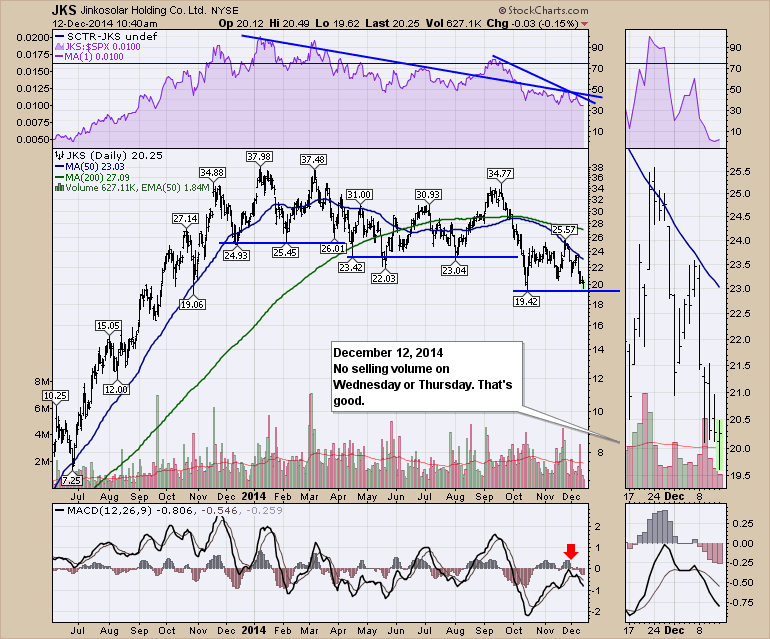
The MACD rolling over below zero is a concern. The histogram is still getting bigger so we'll keep watching.
Next up is Sun Edison (SUNE). This stock goes back a long way. I didn't realize it was publicly traded for so long. I don't know enough about the history of the name, but the chart tells us a lot!
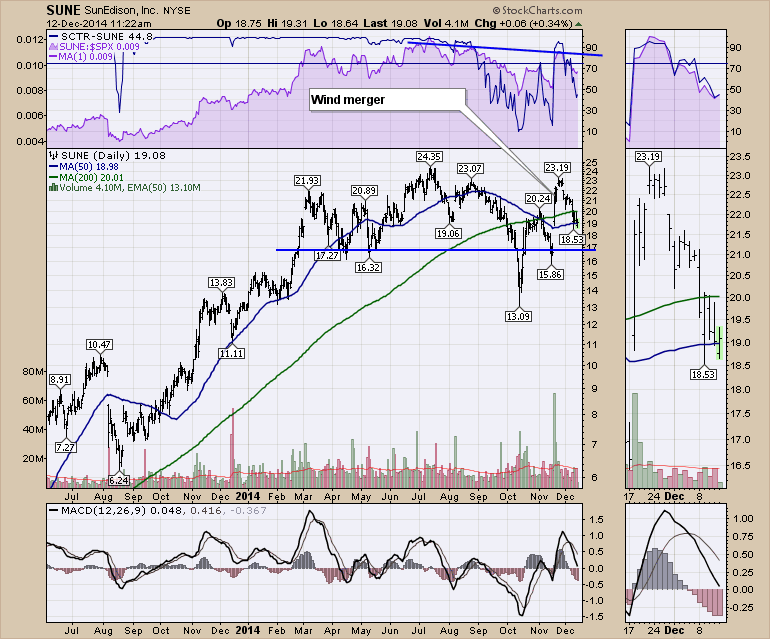
1) The SPURS has been trending up till September and now it is down a little. Very interesting.
2) We can see the SCTR has been living above the 75 line on the right scale. It recently shot up on some merger activity and then pulled back. SUNE bought a wind company. Notice the SCTR ranking at 42.5. Not great if we want to own stocks with a high SCTR ranking, but this is really resisting the tug down the rest of the industry group is feeling.
3) The price action is particularly interesting on SUNE. It has not pulled back like all the other stocks we have looked at. Looking horizontally across the chart is there any surprise the stock needed to pause here after the gigantic run up from $1.44? So we made a lower low that is hard to see on this chart and now we are below $19. It looks like it is still weakening but overall, this is one of the stronger stocks. The amazing part of this chart is you could have owned a great stock with fantastic runs, but if you didn't sell, you might be in a loss position as the stock is in the lower 1/4 of its trading range.
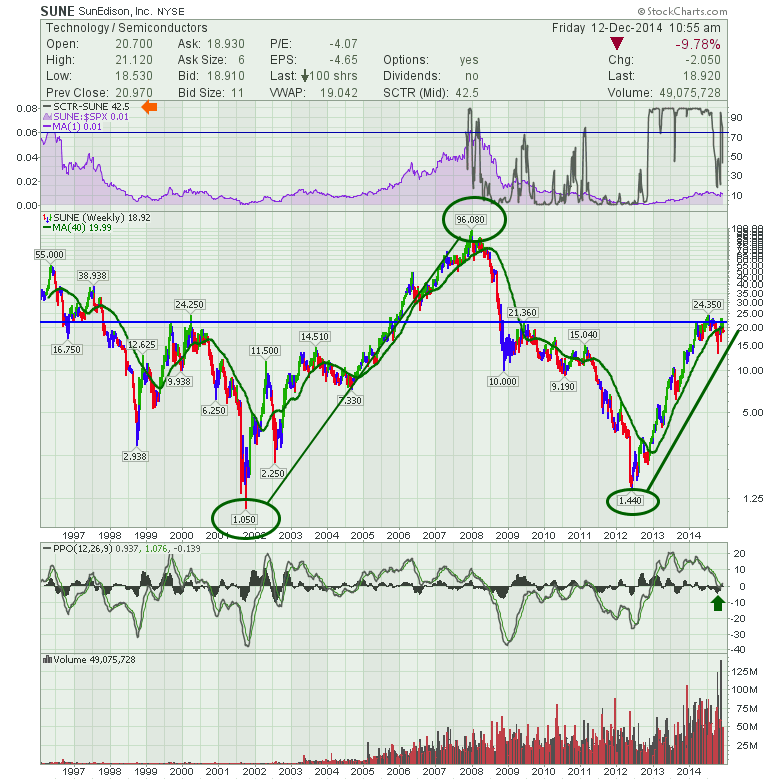
4) the PPO is still above zero but it is below its signal line. How can I tell? Looking at the legend, the third number is a minus but the other two numbers are positive. The first number is the actual value of the PPO. The second number is the value of the signal. The third number is the difference between them. Because that number is negative, the PPO is below the signal line. However, because the first number is positive, it is above zero!
5) The volume just keeps climbing. Most of 2014 has had weekly volume up around 50 million shares a week! That's excellent.
Here is a zoom in on the same SUNE weekly now that we have the big picture.
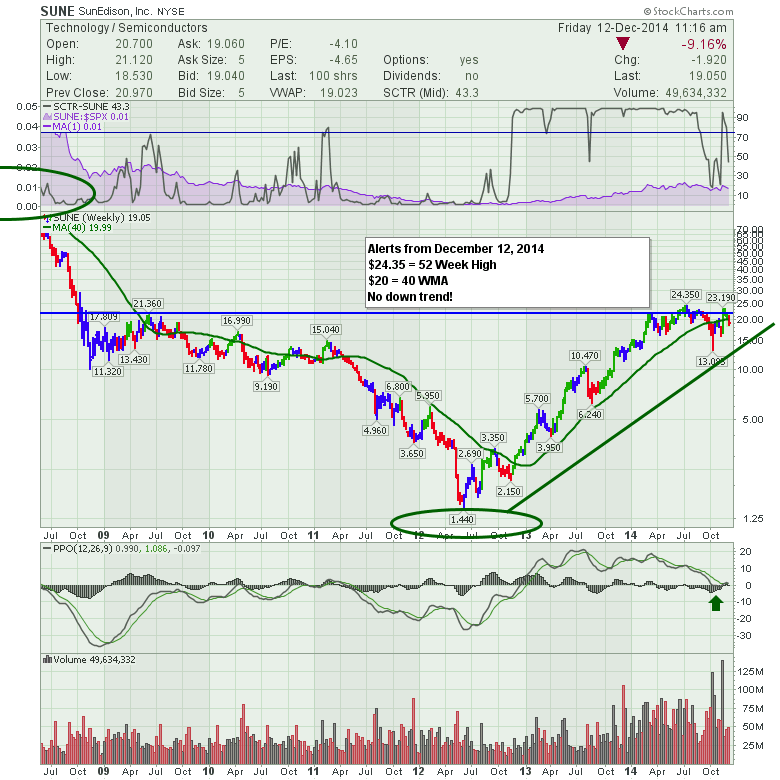
Moving to the SUNE Daily, the blue line represents the highs on the SPURS and is declining. The SCTR jumped above 75 but has pulled back. It looks like a head/shoulders topping structure so far. The measurement is $7 from the high to the neckline, so if it breaks down, it could be $10 based on the pattern measurement. LS= $21.93, Head = $24.35, RS = $23.19. The Weekly PPO above shows the lower peaks on each progression of the pattern which shows the momentum waning on the Right hand side. It is not as clear on the daily MACD. The Daily volume has been under average so even though this is a strong chart, it looks to me like it needs to break down a bit here.
Moving along, we are going to look at Vestas, the windmill manufacturer for wind farms.
1) The SPURS is declining.
2) The SCTR is low around 31 but better than we have seen.
3) Price action is very similar to solar. Lumped in as a renewable, it is moving with solar. I didn't annotate the buy points because the volume is way too light for my comfort.
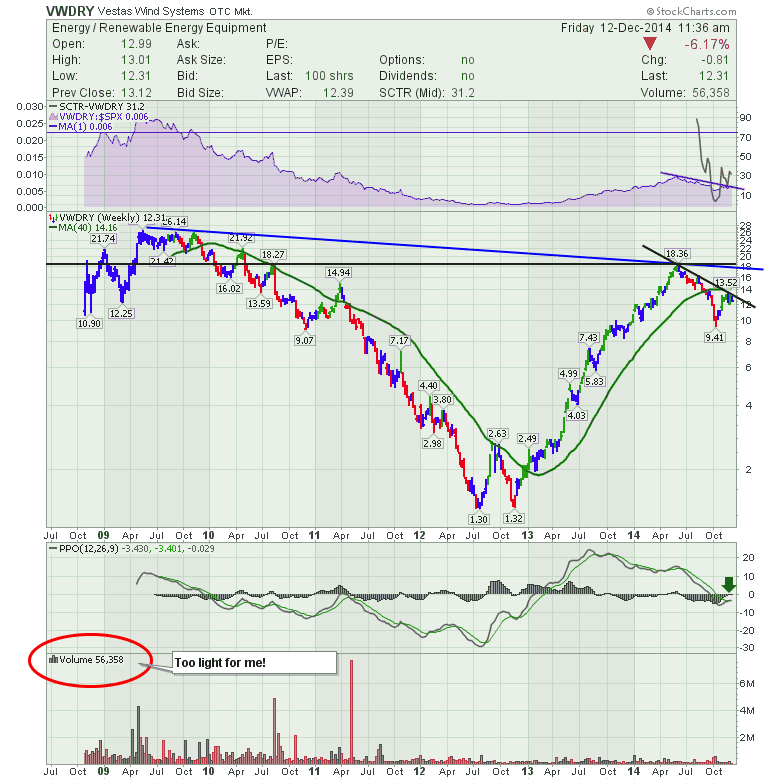
4) PPO is below zero.
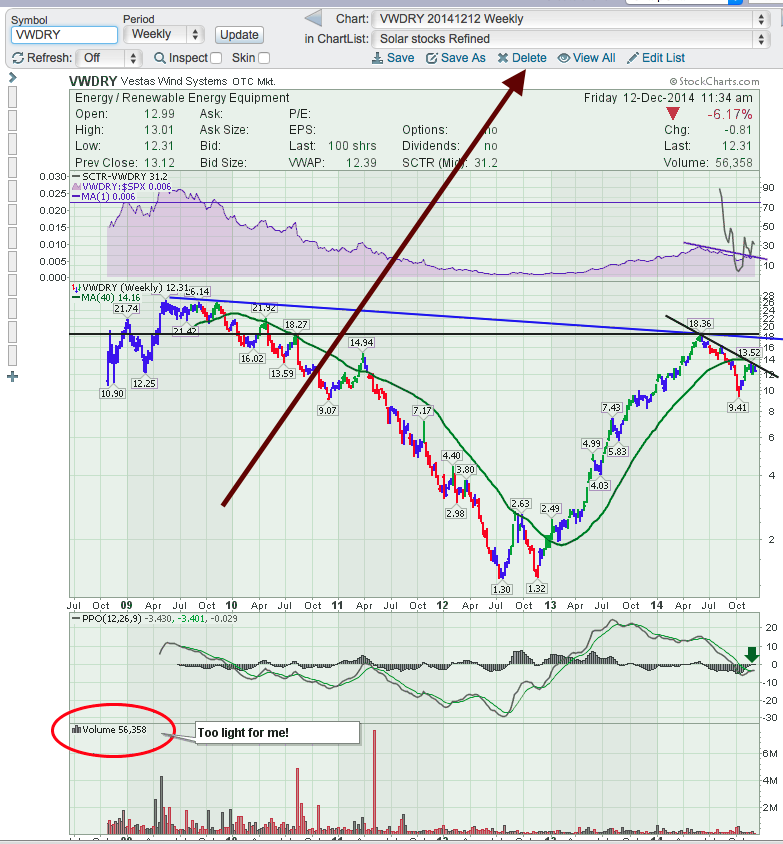
5) Volume is too light. So we can delete this from our list.
How do we delete a chart? Well, straight above the chart in the centre.
We reviewed another three here today. I hope you are enjoying the series. With the general market unwinding, it does not feel like we have to rush in to the industry, but by having everything all set up, we can keep fine tuning and be ready. This weekend, I will go through the remaining stocks and summarize how we can work with this list to monitor it. Enjoy the weekend. We have snow in the mountains so the ski hills are lighting it up.
Good trading,
Greg Schnell, CMT