Today I want to zoom into the currency wars. The equities seem to be the foot soldiers for currency wars. If central bank action/ fiscal policy can get the currency low enough, you can stimulate economic activity. I'll start the explanation between Canada and the US to make the concept clear and then broaden it out globally. Last week we hit 11 year lows on the Canadian currency. Yes, lows from long before the financial crisis. Think about the seriousness of the Financial crisis and now currencies are taking out the 2009 lows. Something big is going on. The Canadian Loonie has plummeted 29 cents in three years and we just had back to back negative GDP quarters. How can the USA be doing so well without us participating? So much for stimulating the economy with a low dollar. What is up with that? Since the end of 2014, the Canadian buck is down close to $0.10 which is remarkable as one of America's major suppliers. While I agree the US Dollar can be strong, Canada's manufacturers should have been finding huge opportunity with the big swing.
Let's talk about what else might be going on. I tweeted out a chart of Martin Pring's inflation and deflation indexes yesterday. (Twitter account @schnellinvestor if you would like to get some of those a little more timely). Let's start with oil. Oil topped at $149 back in 2008. The Canadian Loonie topped a few months before that on a spike high to $1.10. When a person overlays the Canadian Dollar and $WTIC it is a pretty tight match. The only times they diverged is when the currency started to fall before the price of oil fell in both 2008 and 2014. So the rhythm of the Loonie is fully in sync with the price of oil.
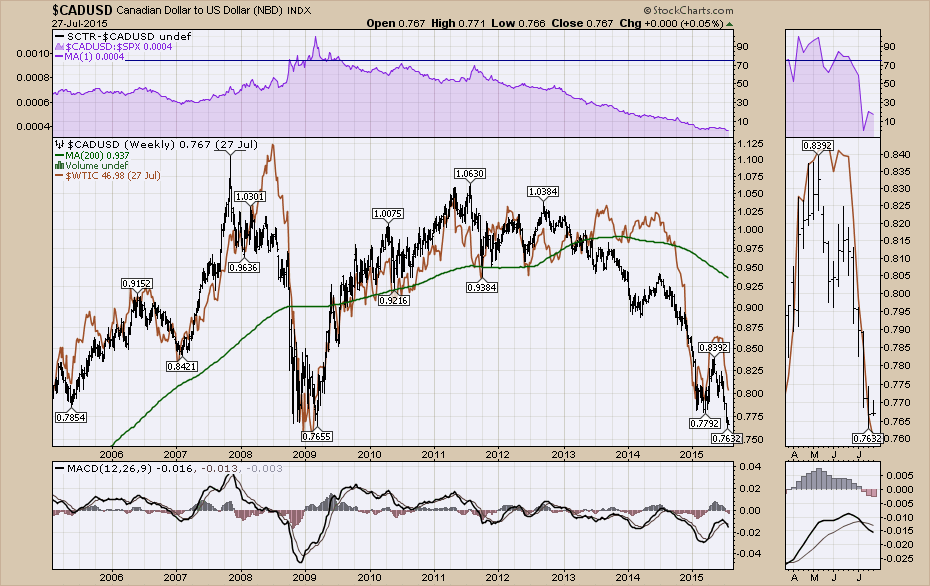
Normally what would happen is that the low price of oil would drag down the Canadian Loonie which would supercharge manufacturers in Eastern Canada and they would carry the torch. Then as the price of oil would come back, the energy sector would have increased profit and growth to get Alberta rolling, but then the Ontario manufacturing sector would struggle with an increasing Loonie.
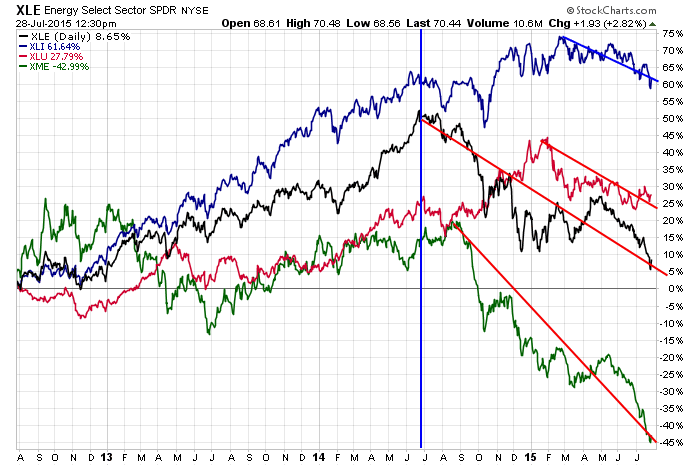
 Yinn and Yang so to speak. That currency move works really well in a fully functioning economy. It does not work as well in a deflationary economy where there is no demand and capacity has been largely overbuilt. The US Industrials have declined meaningfully. Currently, the Industrials, Utilities, Materials and Energy are all beaten down sectors. When these four sectors are working, there is real industrial demand and growth. As recently as the spring of 2014 all of these sectors were rising.
The real difficulty is that the lack of demand started to show up when the oil price crashed. The oil price crashed because of two things. A softening of demand and a change in the Saudi approach to OPEC price management where they will pump oil without throttling the volume based on end demand. This oversupply and weakness in demand collapsed the industry. In North America, our production costs are higher. Because the Oil industry was 1/3 of all the 2014 Capital spend in the S&P 500, we have a lack of industrial demand. This has already closed steel mills etc. I wrote about this recently in the article on the Martin Pring Market Roundup Blog for subscribers (Everyone's Concerned About Industrial Disease).
This week, as oil companies are formulating their new budgets, economists around Alberta Canada estimate $200 Billion in stopped projects in Alberta alone. That is $200 Billion of jobs and demand for industrial goods across North America from just one region.
Now the manufacturing sector in Eastern Canada needs to find other projects that they can manufacture goods for in America. The problem is the rapid slowdown in the oil sector has dampened demand. As the oil companies move to the next budget cycle and continue to cut projects and people, this creates a lack of demand for new homes, trucks and consumer discretionary to name a few. This takes time to show up in the economy. Currently everyone is still buying Nike shoes and Under Armour. It is the deflationary environment that is creating this tricky situation for the currency. The lowering of the dollar is only good if the manufacturers can find something to profitably manufacture. So how strong is America's economy so we can sell into it?
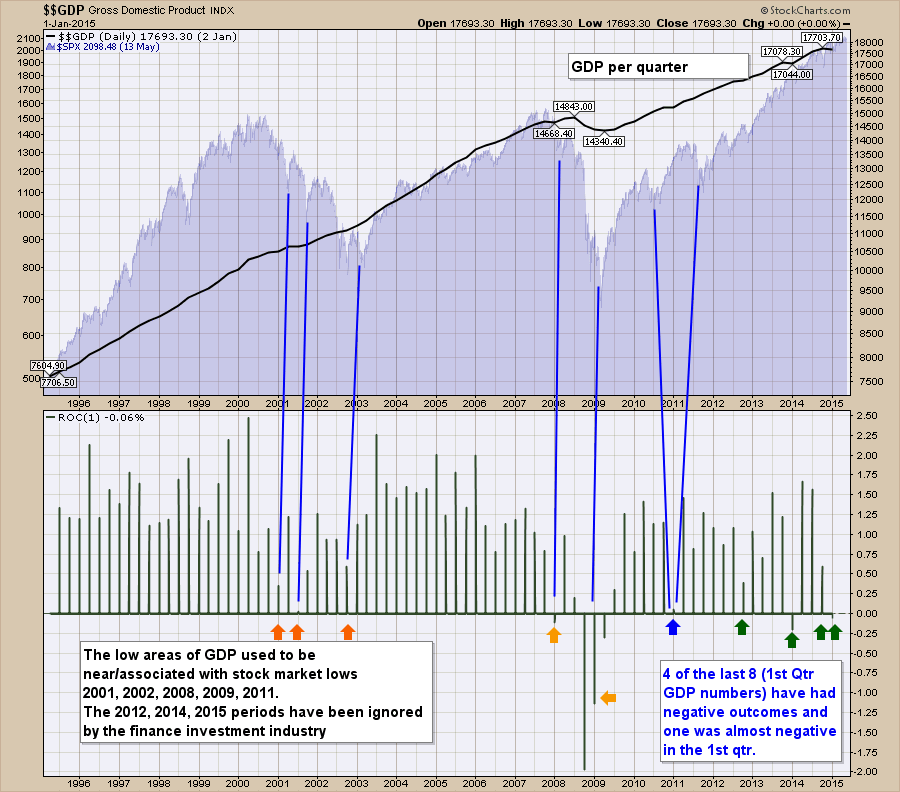
This chart below is from the Federal Reserve of Atlanta.
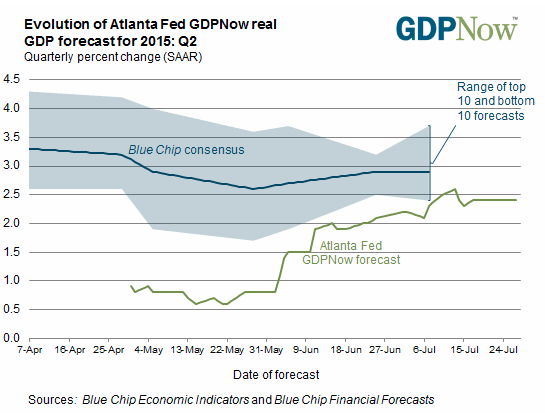
The Atlanta Fed has created a GDPnow forecasting tool that seems to track real GDP better than the other models the Fed has. How long that tracks is a great question. The real problem is that their forecast is below every forecast in the private markets. So 2.4-2.5% GDP growth is better than the first quarter which was slightly negative. Below is the chart for GDP going back 20 years. Recently, the stock market has been immune to the dips in GDP. The last four dips in the Rate of Change of GDP would have been big enough to get a response historically, but now we don't respond to the data. While this may be great in hindsight, it does not give an investor confidence that the stock market reflects the US economic conditions or the economy worldwide. Are we immune to reality or smarter than relying on economic data to base our investing on when the Fed has our back?
So while the overall US economy is not shining brightly, its one of the better economies. While the 'drum rolling', 'breaking news' press make every data point release a big deal, the reality is the economy has endured a tough suite of releases and the market is holding near the highs. So is the US an island, or is it just that the institutional investors are willing to invest where there is rock solid Fed support and avoiding the economies without QE? Could it be that simple? With that backdrop, I want to roll through the charts of the currencies with the regional stock markets attached and once we have all these charts we can debate more openly.
Let's review the charts of QE countries and non QE countries. We want to look for investment gains where the institutional investors are playing follow the Fed. The question is what roles can the weak currencies play to help these countries that are under performing? It does not seem to be helping yet.
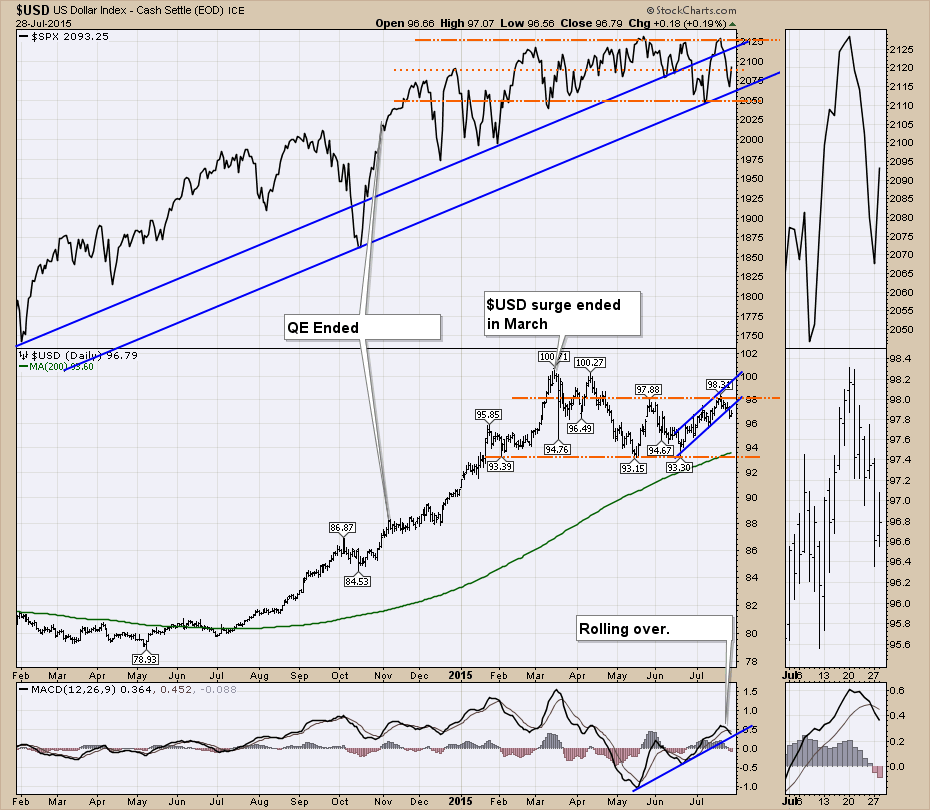
Let's start with the $USD. Everybody is talking about the soaring $USD. It stopped soaring 4 months ago. After its trip to the lower boundary again in June, we could say it has been range bound for 6 months going back to February.
Since QE stopped, the $SPX equity market moved higher for another 40 days and then started to oscillate back and forth. In February, the $SPX soared from the low of the range to all time highs. The sudden run up followed the optimism of the Eurozone stimulus. Since February 5th we have been in a range that includes that burst. After a run up from November 2012 to October 2014 where there was US QE stimulus, we could say the S&P 500 has traded in a wide 100 point range. No progress higher and the breadth has been meaningfully reduced with around 50-60% of the group still on buy signals rather than the 75% level (Not Shown).
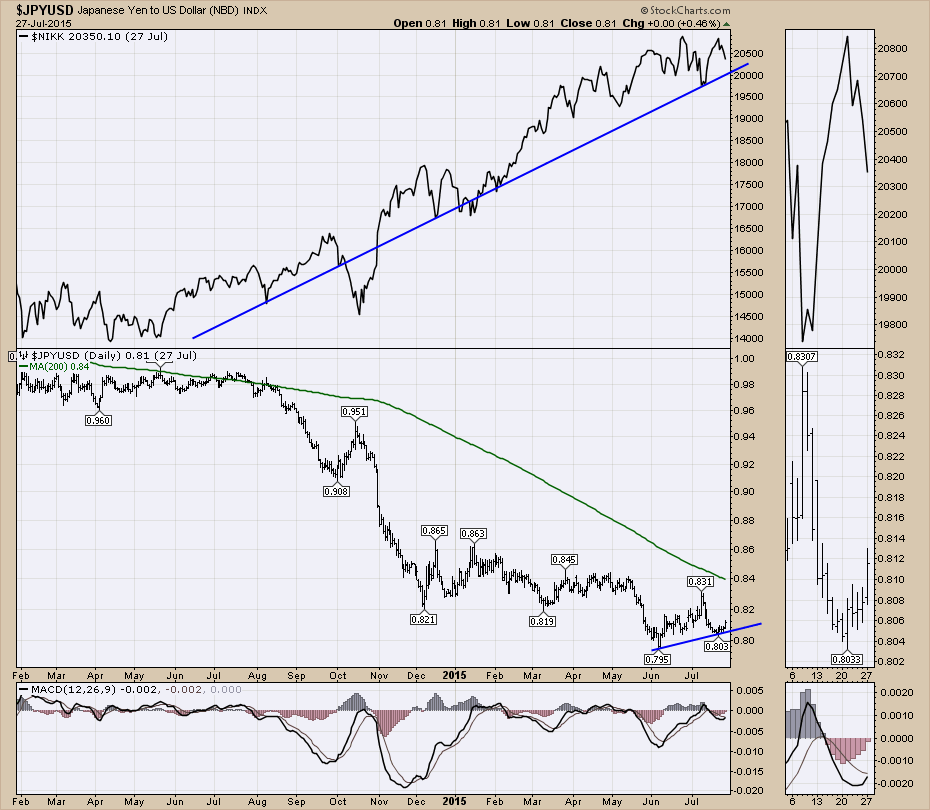
Another country with QE is Japan. QE is still engaged. IMF is giving them warnings about unsustainable debt levels but the trend continues. The Japanese market continues to be 'fairly valued' if you listen to institutional investors but the government is on an unsustainable path of debt so the currency keeps unwinding. The weakening currency is helping stocks there. The weakening currency in Europe didn't help the Greek market and they too are on an unsustainable path but their tax system is not as well organized as Japan. So Japan continues to offer the most promise with a weakening currency, rising debt, QE and optimism. If the currency continues to unwind maybe it all works out in the end. The MACD for the Yen is approaching the zero level. If it suddenly shot higher, I think this could be a major destabilizer. There are a lot of investors using a depreciating Yen for their account. If that trade reverses, that would be a pillar the market has relied on.
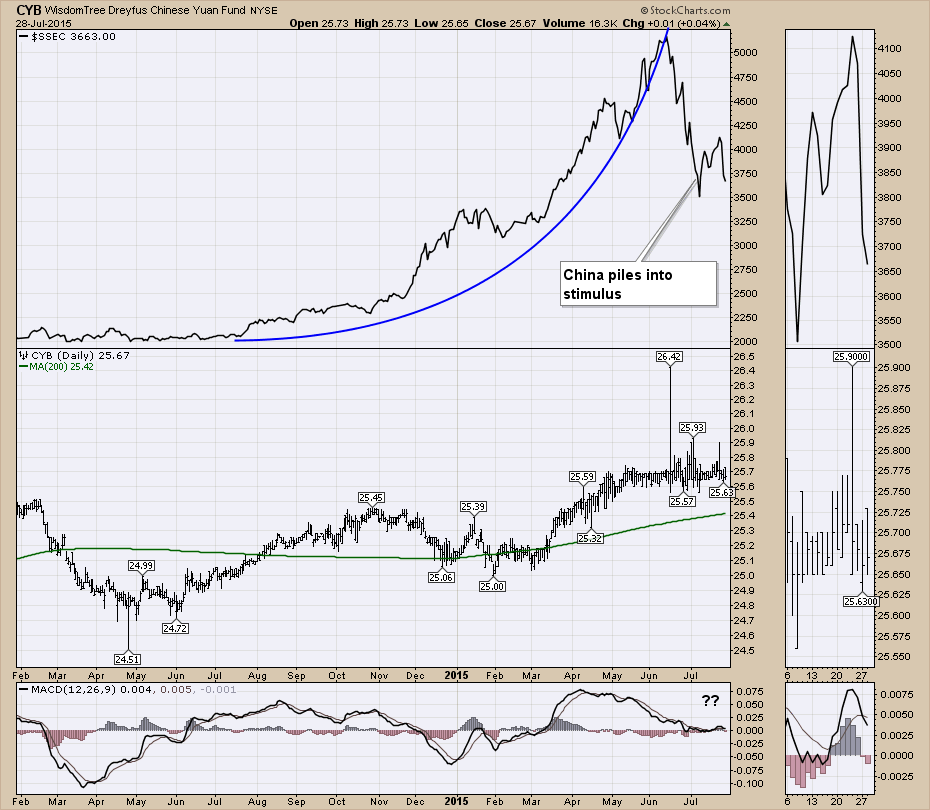
The Chinese market is currently getting massive stimulus to halt the recent decline off a parabolic top. This market is considered somewhat different based on the visible hand of government. Currently the Chinese monetary officials are using multiple methods to stabilize the market in China. We won't get into the politics of their success vs. our success with stimulus. The bottom line is the market does not look stable yet.
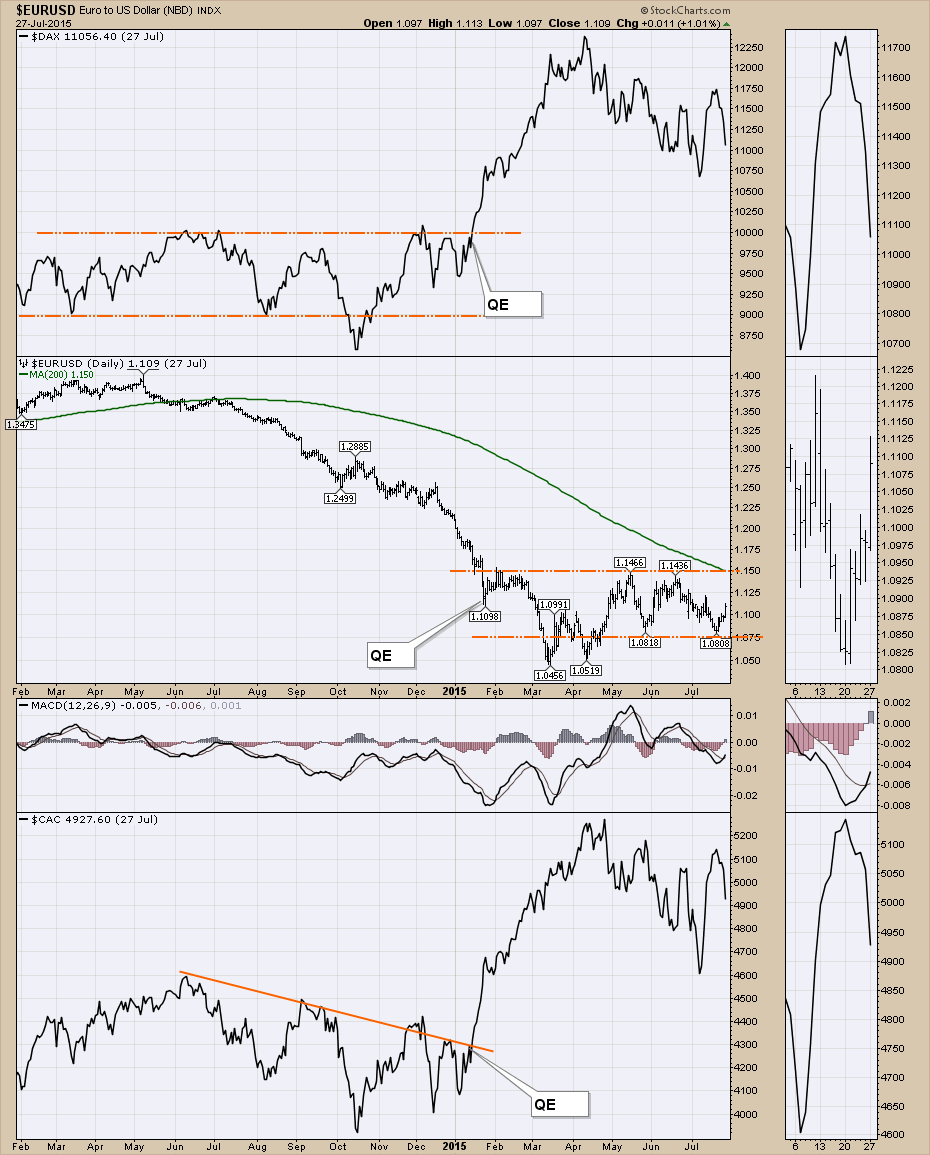
Mario Draghi announced the QE program for Europe in January. It is supposed to continue for at least 18 months. I have included France on the bottom panel and Germany on the top. While the Greek crisis has been going on, the two markets have weakened about 10% so far.The Eurozone appears to be undecided on direction, but institutional investors worldwide are piling in because of the monetary stimulus. With the US strong showing today, we could probably expect a higher close in Europe tomorrow.
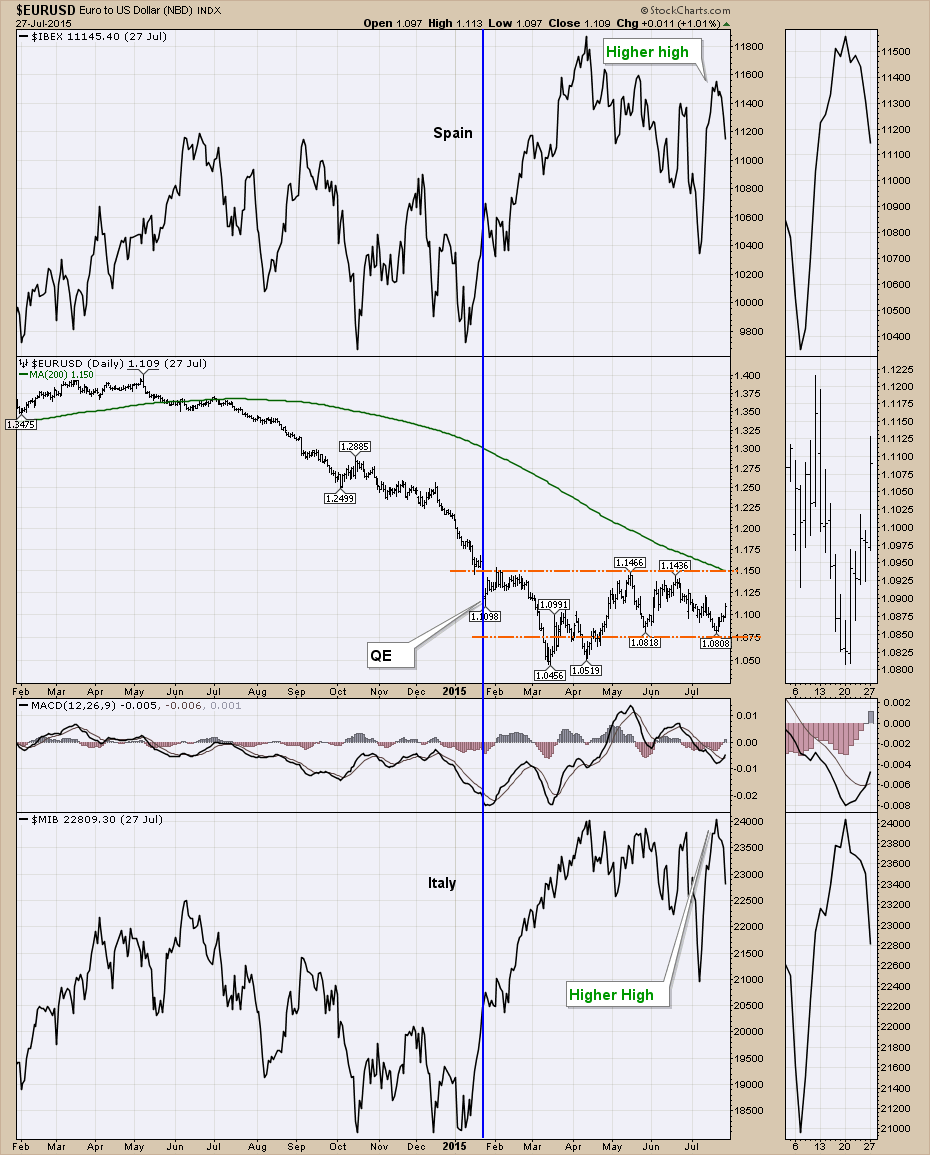
Using the Euro again, we can look at 2 other exchanges. Spain and Italy are both debt laden in their own right, however the market is buying that QE will work with higher highs recently. The rollover last week was quite significant.
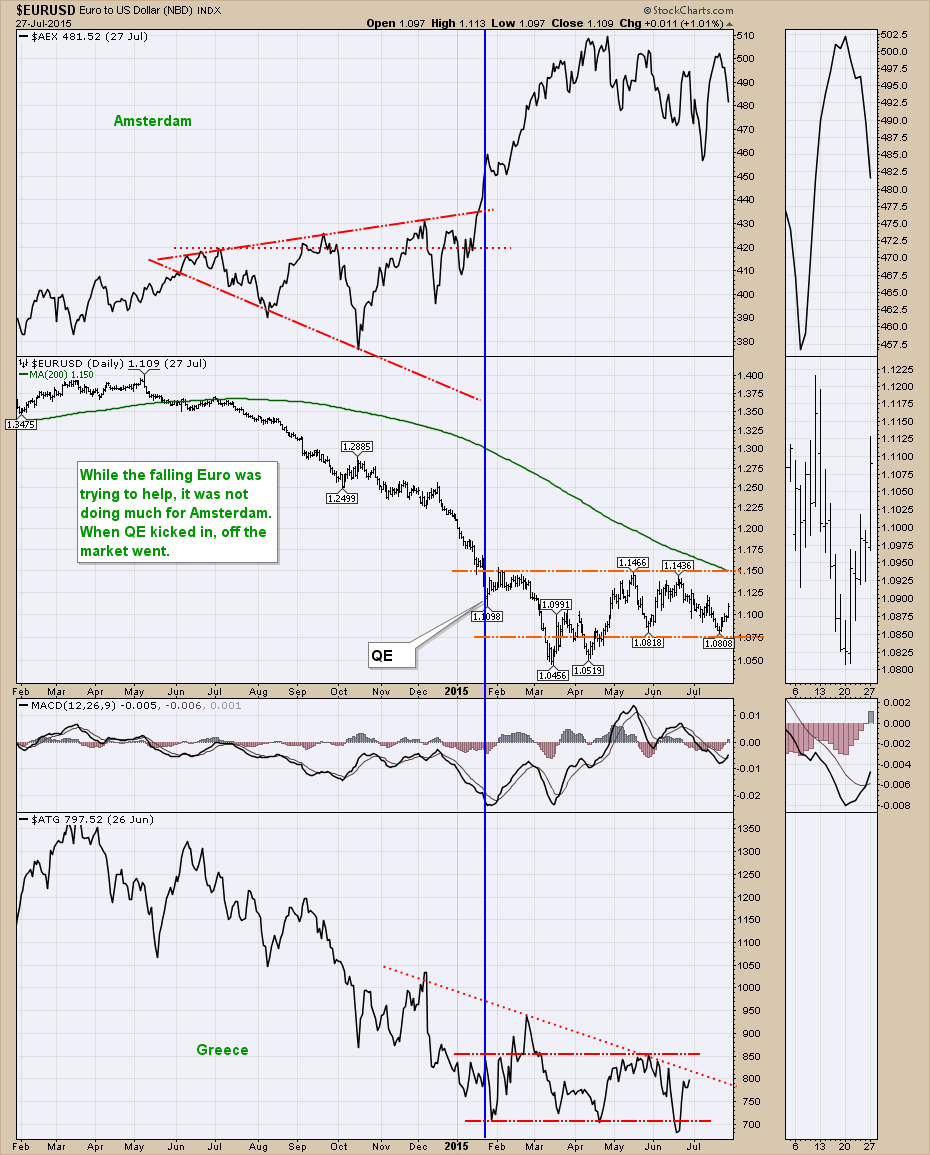
Here is the Amsterdam Exchange ($AEX) and the Greece Exchange($ATG) is shown in the bottom panel. Greece could not control or devalue the Euro fast enough to save them from the debt mountain. Amsterdam looks like the German and French markets.
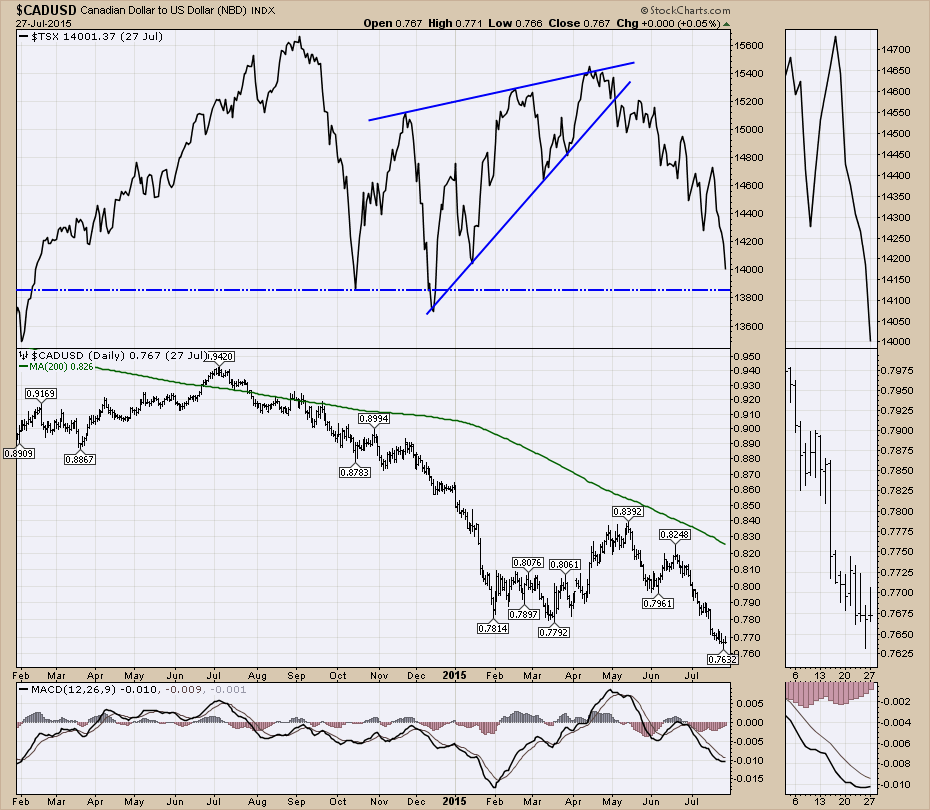
Now let's look at markets that have not done QE recently. Here is Canada shown with the same chart configuration. The commodity related countries like Canada are looking very weak and the low dollar is not helping. Canada jolted higher with Eurozone QE optimism as well.
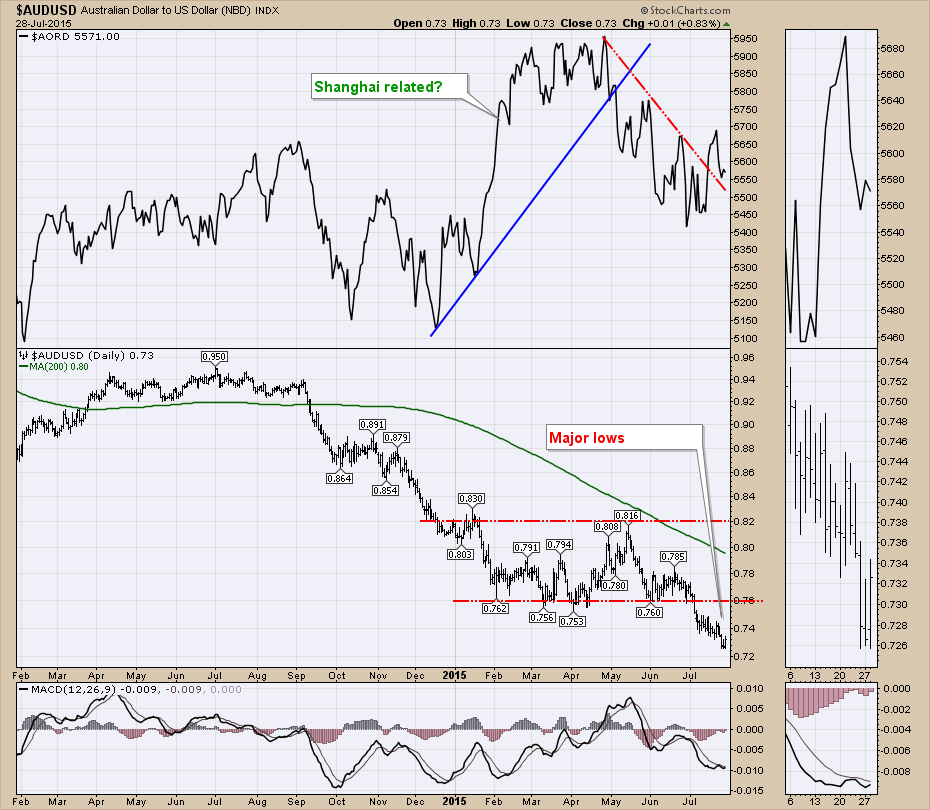
Here is Australia. Australia's run up looks like it should belong to Shanghai but it was the same time window as the Eurozone QE and the size of the move was similar to European moves. Let's call it a double whammy. 5500 is an important support level for the Aussie market so watch that market closely.
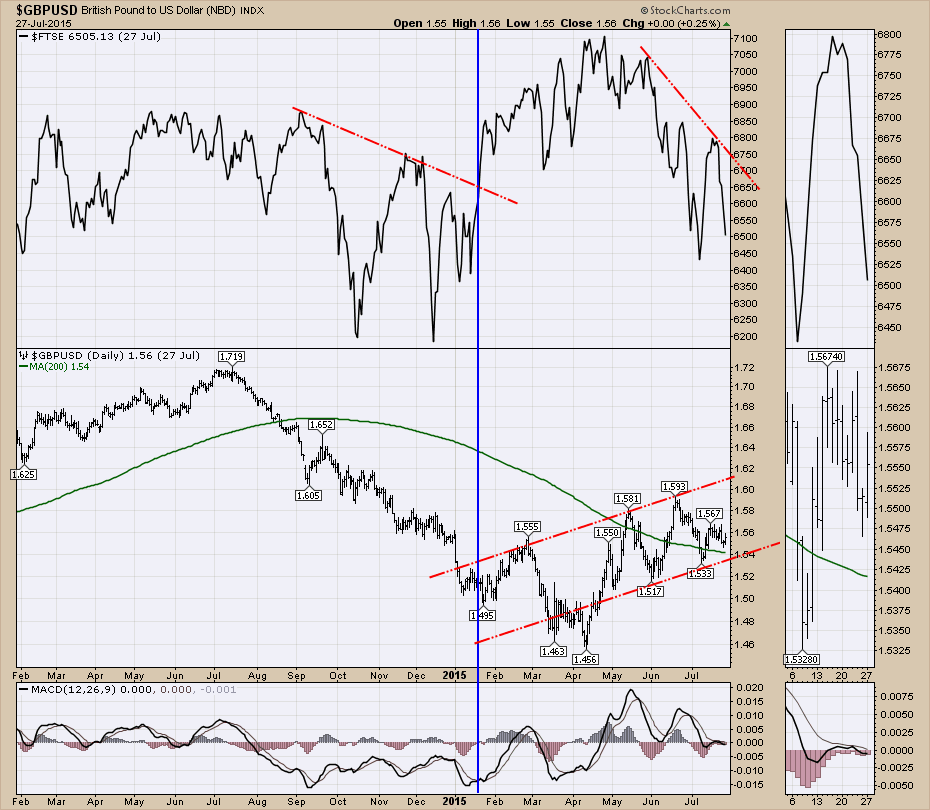
Here is the UK. The British Pound is mid range, but trending higher. The stock market is very weak and similar to Canada as they have a lot of mining stocks there. Interesting to see the Pound rising with all the deflationary price action on the index. Double the pain.
My analysis based on the charts above are that the European Union QE program rallied markets world wide. That appears as a general trend on every chart. Some of the notes below are from the chart areas above but consolidated into a larger picture here.
The Japanese market continues to be 'fairly valued' if you listen to institutional investors but the government is on an unsustainable path of debt so the currency keeps unwinding. The weakening currency is helping stocks there. The weakening currency in Europe didn't help the Greek market and they too are on an unsustainable path but their tax system is not as well organized as Japan. So Japan continues to offer the most promise with a weakening currency, rising debt and optimism. If the currency continues to unwind maybe it all works out in the end. Greece could not control or devalue the Euro fast enough to save them from the debt mountain. The MACD for the Yen is approaching the zero level. If it suddenly shot higher, I think this could be a major destabilizer much like Greece was.
The Eurozone appears to be undecided on direction, but institutional investors worldwide are piling in because of the monetary stimulus. My interpretation is this trade might not work out well yet.
In the US, the markets have not made any progress other than the sudden run up immediately following the optimism of the Eurozone stimulus. The pullback shown on the charts of the Industrials, Mining, Energy and Utilities suggest more than just a summer lull. I believe the extreme collapse of the energy segment is starting to have a knock on effect. Chevron announced more job cuts tonight and Microsoft announces some recently as well. Some of the Social Media stocks seem impaired and the semi-conductor area is weak. Even HACK put in a subpar gain today. The $USD is mid range as well, but the commodities and foreign commodity currencies are getting crushed.
The commodity related countries like Canada are looking very weak and the low dollar is not helping. The British pound is mid range, but the stock market is very weak and similar to Canada as they have a lot of mining stocks there. The rising currency trend and the declining $FTSE are double trouble. The Aussie market is worth watching right now. Since the recent break below support, the Aussie market has rallied. This also coincides with the stability measures of the Chinese.
Almost every market topped out so far in March, April or May. The rally following the emergency meetings over Greece were lacklustre. The commodities have been crushed even while the $USD has moved sideways so something else is changing. With the recent move to Consumer Staples breaking out to new highs in the US, there is more changing.
The indicators on the $USD say lower to me and the recent breakout had no momentum, so it pulled back. That could provide a commodity related bounce, much like a NASCAR after flying off the track. We are hopeful everyone will be all right, but we are never sure. Everyone believes the EU has stopped the deflationary forces, but that is not what the charts are telling us. Commodities are down hard while the $USD moved a begrudging 2 cents over a month. Hardly a massive push in the dollar as it was in the range recently travelled 3 times prior to the most recent move. The grains have unloaded in price. Livestock has started a bear market decline. Energy and Precious Metals are the obvious decliners. Industrial Metals have plummeted below their channels. It feels like there is lots of shifting sand below us here. The markets seem undecided on Greece as that market has not rallied.
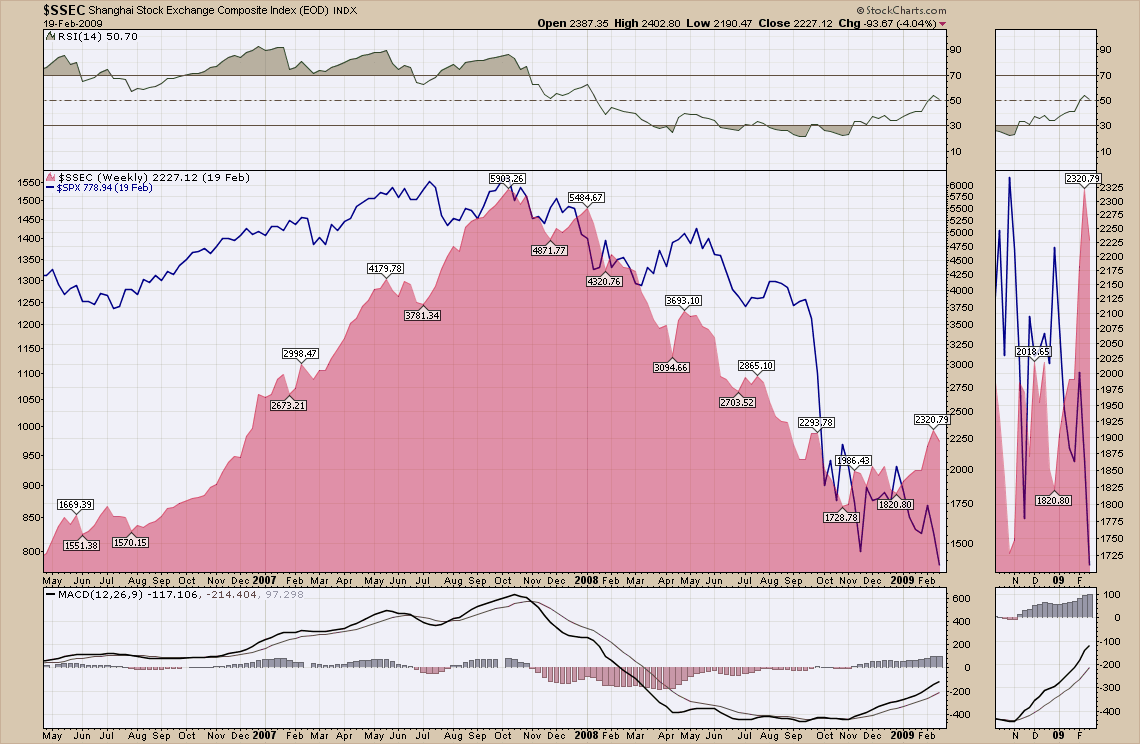
Here is the chart of the parabolic rise in China and the top of both the $SPX and the $SSEC. Shanghai ($SSEC) is shown as an area chart. The MACD and the RSI are for the Shanghai.
This is the 2007 top.
This is the current picture.
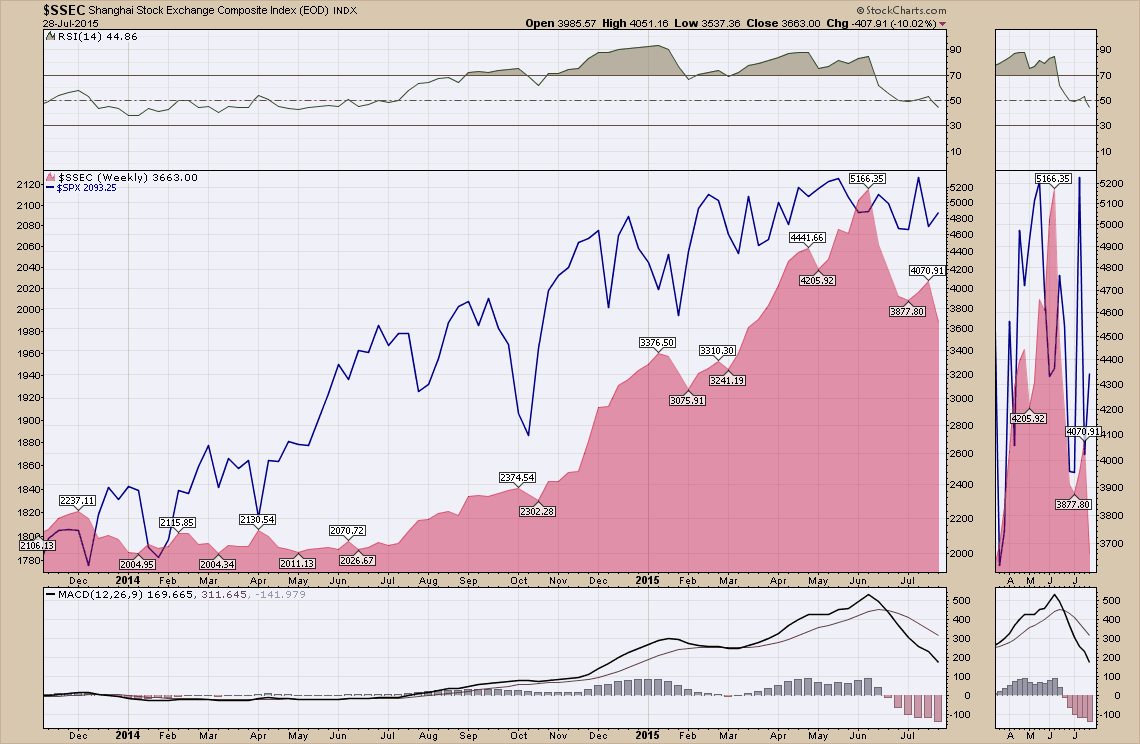
We are about to find out if it is different this time.
I can see the tension building in the charts. The Bollinger Band Width on the $SPX is near all time lows and is definitely very low as a percentage of price. The calm before the storm. The Commodity markets are screaming deflation. The Fed Chair is screaming for inflation. China puts pressure on everything. Mr. Putin must be at the lake on holidays because he has been quiet of late.
Martin Pring and I will be doing a very important webinar this week. We will try to dialogue through some of the main hinge points for the markets. I don't expect anything from the Federal Reserve tomorrow other than Quantitative Speaking. Talking up inflation, talking up employment, and staying away from durable goods orders and the commodity slide. Here is the link to register...Greg and Martin.
This article took awhile to write as I tried to build a clear story through a variety of influences. I apologize if it is not as concise as you would like. Dialogue below by commenting on what you see in the charts. Perhaps I missed something. It would be good to put it out there.
I like hearing from you so feel free to comment. One of the comments recently was specifically asking about the Canadian Dollar which created this article. Register for the webinar as I plan to walk through this information and subscribe to the blogs using the email subscribe tool found on the top right of each one. John Murphy, Arthur Hill, Martin Pring and the Decision Point blogs have all had excellent information in their blogs for subscribers. As we approach this confluence of pressure on the charts, hopefully you are finding the subscription to be well worth the value in content alone.
Good trading,
Greg Schnell, CMT