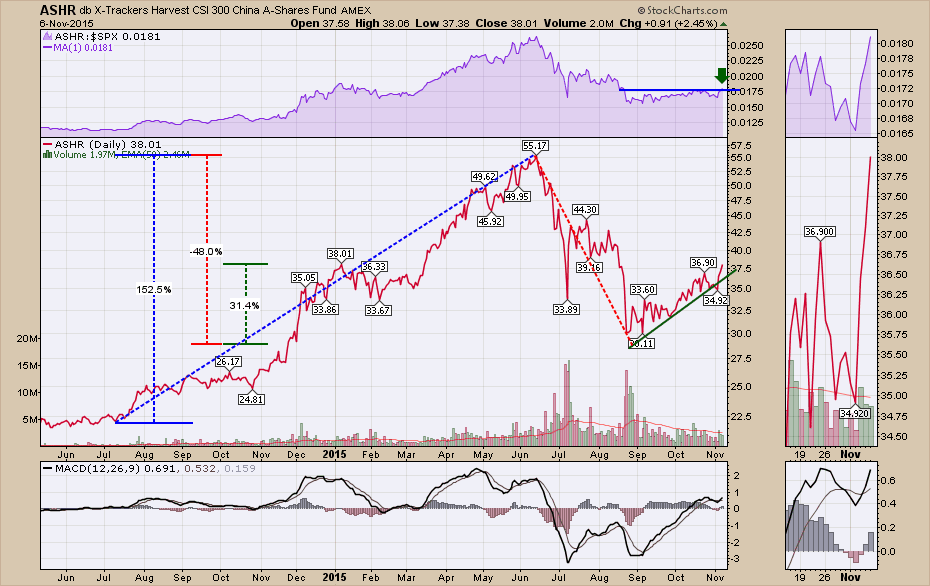
China (ASHR) has been a roller coaster for investors in the system. After making a meteoric rise of 150% in one year, the prices dropped by 48% and have now risen 31%. Today marks a very interesting place on the charts.
The zoom panel on the right shows the Relative Strength in purple breaking out to 2-month highs. Fresh breakouts to three-month highs were very bullish on the chart below and is usually a good thing to keep track of. The MACD has given us a positive cross and this is trying to accelerate with 2 positive histograms on the MACD (look in the zoom panel for the fine detail).
Here is what makes me wonder the most. Could it really be that a move of 150% corrects in 2 months on a market the size of China and everything is ok? I don't know the answer.
Let's go back in history and look how a meteoric rise in an index played out before. On the mystery chart below, I show some similar price action to what we have just seen on the ASHR ETF that tracks the Chinese market. A huge surge of 130% from a consolidation that lasts 9 months, a significant breakdown that lasts 2 months and a spurious rally of 30%. Is it time to get bullish?
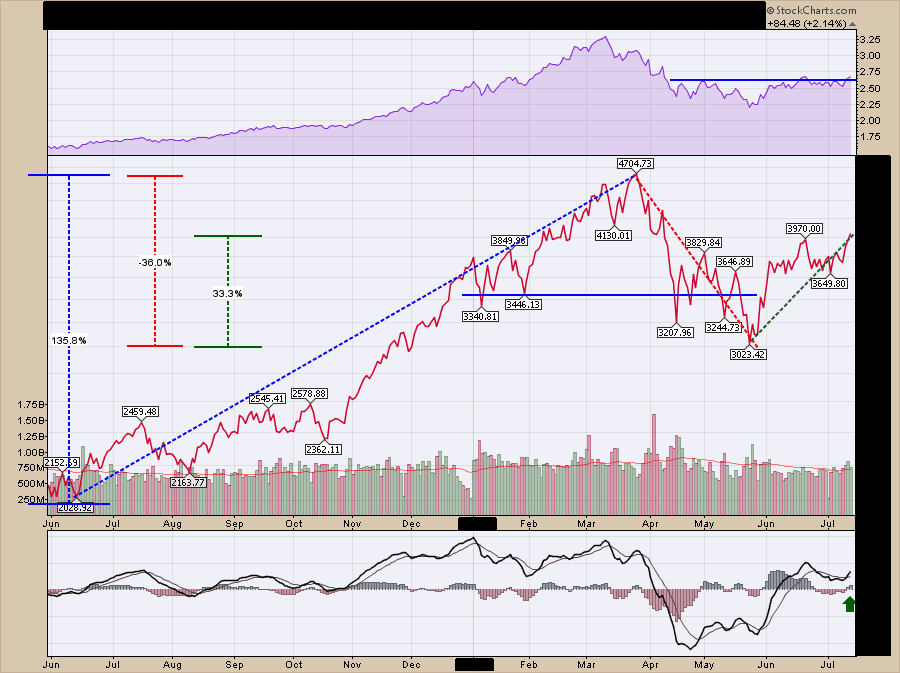
Here is the mystery chart published in all its glory, 2 years later.
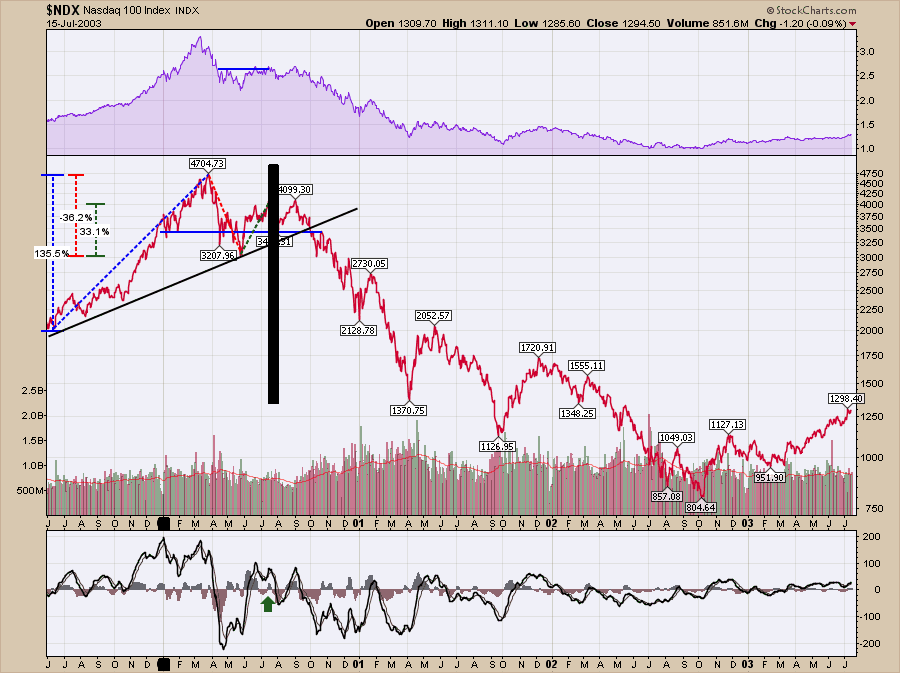
The Nasdaq 100 ($NDX) chart above used the final low in the consolidation in 1999 as the starting point for the measurement. I wanted to outline that just in case you are wondering how I picked that point. Notice I have drawn a sloping solid black line defining the uptrend and I extended the horizontal blue line on the Nasdaq 100 chart. When those were broken, it was time to leave the party.
I don't know how the Story Of The Shanghai ends, but it could be great or it could be Back To The Future 2015. Let's look at the ASHR chart with those two lines in focus. Let's assume this could be the start of something wonderful. A breakout to three-month highs in relative strength is always a good thing to participate in. By having hard stops under our trade and giving it room to move, we can participate if this does go on another run. At this point, a stop around $33.50 - $34.00 would be a way to trade it.
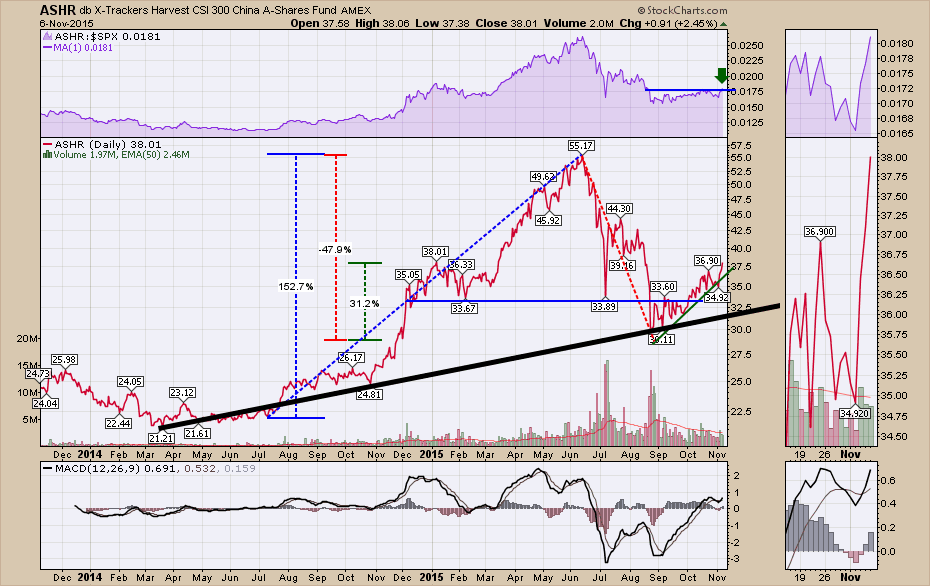
If either the horizontal blue line or the solid black line is broken, I would exit and watch for wider repercussions around the world. When China catches a cold, we all seem to be impacted.
I also covered a lot of information in my webinar on Thursday. Click here to see the webinar. Commodities Countdown 20151105.
Good trading,
Greg Schnell, CMT