The McClellan Oscillators for the NYSE and Nasdaq surged over the last few weeks and hit multi-year highs. Medium-term, I would consider this breadth surge bullish. Short-term, however, it creates an overbought condition that could lead to a pullback or consolidation in stocks. Despite this double-edged sword, the medium and long term prognosis outweighs the short-term.
The NYSE McClellan Oscillator ($NYMO) is leading the charge with a surge above +100 and its highest reading since January 2009. In less than two months the indicator has moved from -89.2 to +105.77, which is a massive 205 point swing. This shows a sharp shift in breadth that I would consider as a bullish breadth thrust.
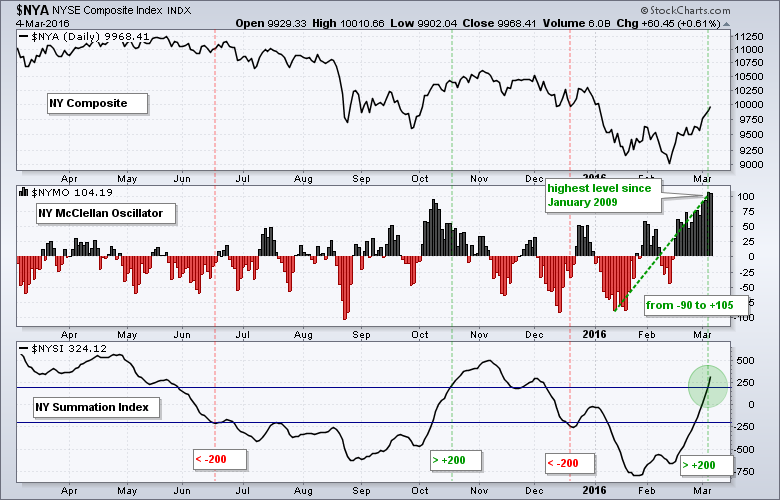
The bottom window shows the NYSE McClellan Summation Index ($NYSI) moving above +200 for the first time since early December. I am using +200 as my bullish threshold and -200 as my bearish threshold to reduce whipsaws. The NY Composite bulls have a medium-term edge as long as this indicator remains above -200.
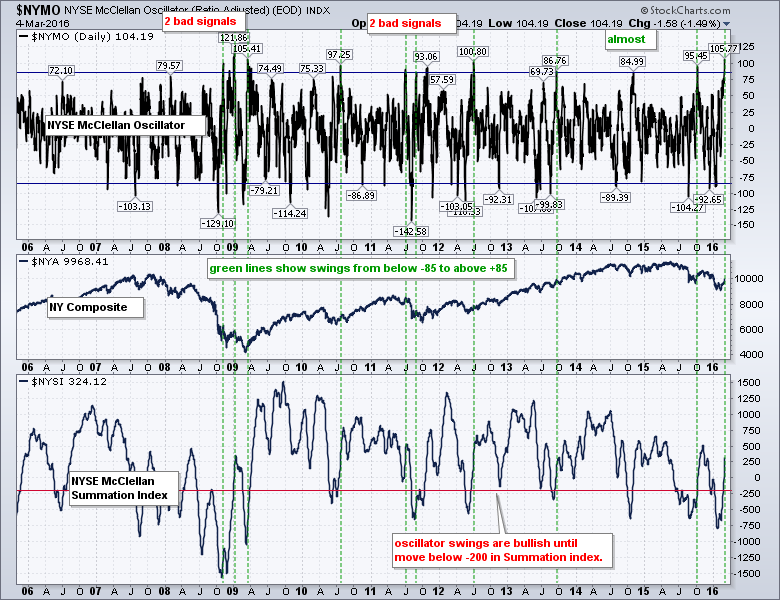
The next chart shows the NYSE McClellan Oscillator over the last ten years. I added horizontal lines at -85 and +85 to identify swings from a negative extreme to a positive extreme. Some chartists use -80 and +80 so feel free to make adjustments. By my count, there have been at least ten such swings. Two occurred at the end of the 2007-2008 bear market, one marked a breadth thrust in March 2009 and the three of the next five preceded big advances. The other two were head fakes (bad signal) in July and August 2011. This was a period of extraordinary volatility and the oscillator surged above 90 October 2011. The bullish swing in October 2015 did not last long as the NY Composite peaked in November. The jury is still out on the current breadth swing, but I think it is bullish as long as the NYSE McClellan Summation Index ($NYSI) remains above -200 (red line).
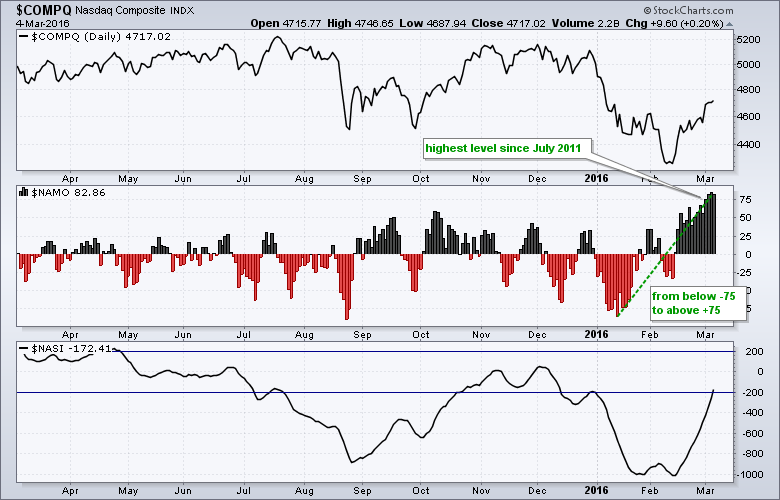
 Note that I am showing the NY Composite with these NYSE breadth indicators. It does not make sense to show NYSE breadth with the S&P 500 because there are 114 Nasdaq stocks in the S&P 500, which is 22.8% of the index. The chart below shows the Nasdaq McClellan Oscillator ($NAMO) and Nasdaq McClellan Summation Index ($NASI) for reference. Those unfamiliar with these indicators can learn about them in our ChartSchool.
 ****************************************
Thanks for tuning in and have a good weekend!
--Arthur Hill CMT
Plan your Trade and Trade your Plan
*****************************************