After a rough week where many traders sold on the news of Brexit, a four-day climb has taken us back to the highs before Brexit. This increases the weekly range and volatility, but interestingly enough, the market shocks all seem to come from offshore these days. Let me outline a problem, and then provide a chart that looks investable.
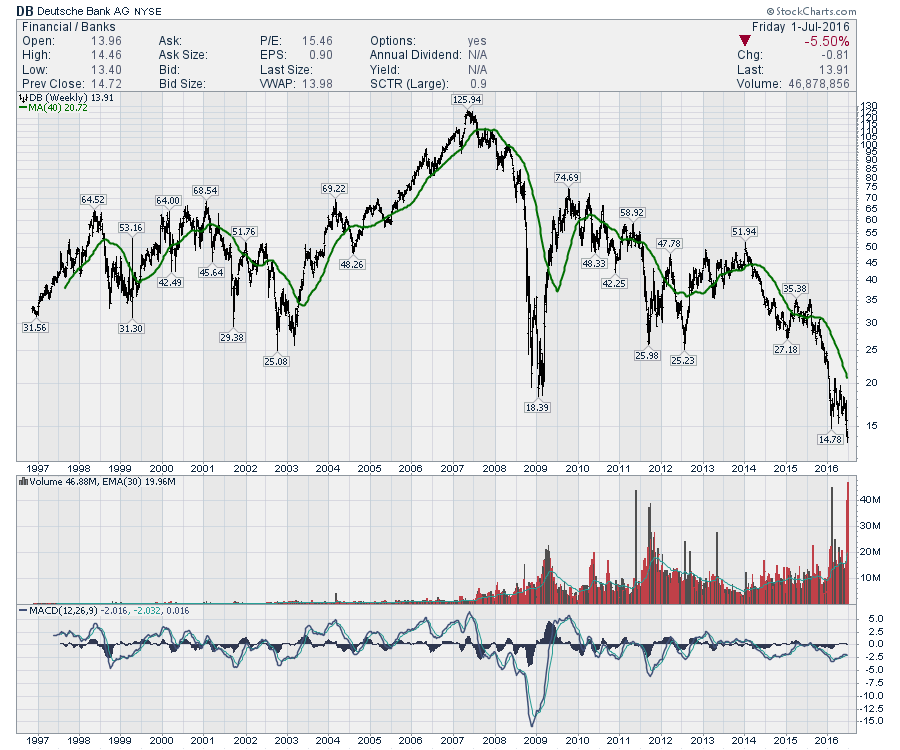
If Brexit does end up being the trigger for a systemic banking problem, you'll need to evaluate your entire portfolio. Looking at the chart of Deutsche Bank, it looks a lot like a Lehman Bros. chart in the terminal phase. When the CEO has to comment 'no need to raise cash' and on the other hand, they are failing to meet regulatory levels, the clarity is not high.
That said, the band plays on. As investors, we still need to find returns. I recently published a Don't Ignore This Chart article pointing to where the money is flowing inside the USA after the vote.
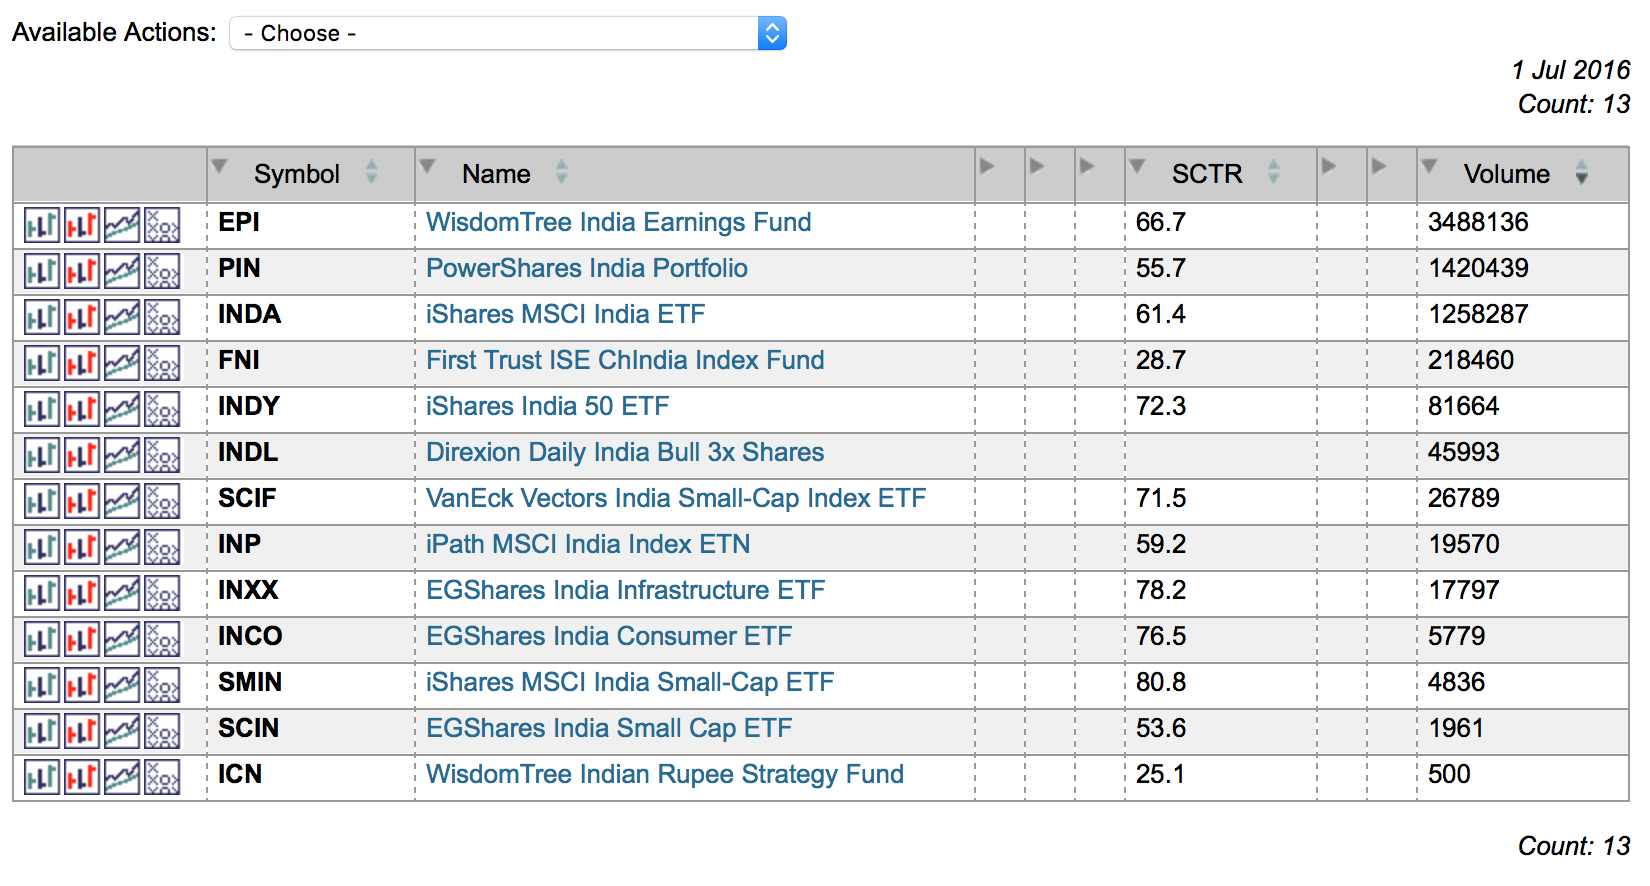
On an optimistic note, we can look for what is working smoothly. One area of the world that I always like to keep an eye on is India. The country has the world's best demographics and when their market blipped on Brexit, I was intrigued. The British influence is there in India, so I would have expected more. Running a quick scan on our US ETF Universe, I found 13 ETF's for trading India in various ways.
 Looking at the iShares MSCI India ETF (INDA), we can see a trading volume over 1 Million per day and the SCTR is 61.4. The SCTR recently rallied above 75 and pulled back while in an uptrend in price. I like that as a market that is starting to outperform. StockCharts SCTR is a ranking method that uses price action to determine which stocks are performing better than others rather than using patterns. The higher the SCTR score, the better the performance relative to peers. The weekly close was the highest close in the last 8 months, and the level of $28 was breached this week. $28 has been an important support/resistance level on this chart for 4 years. Click here for more information on StockCharts SCTR ranking system.
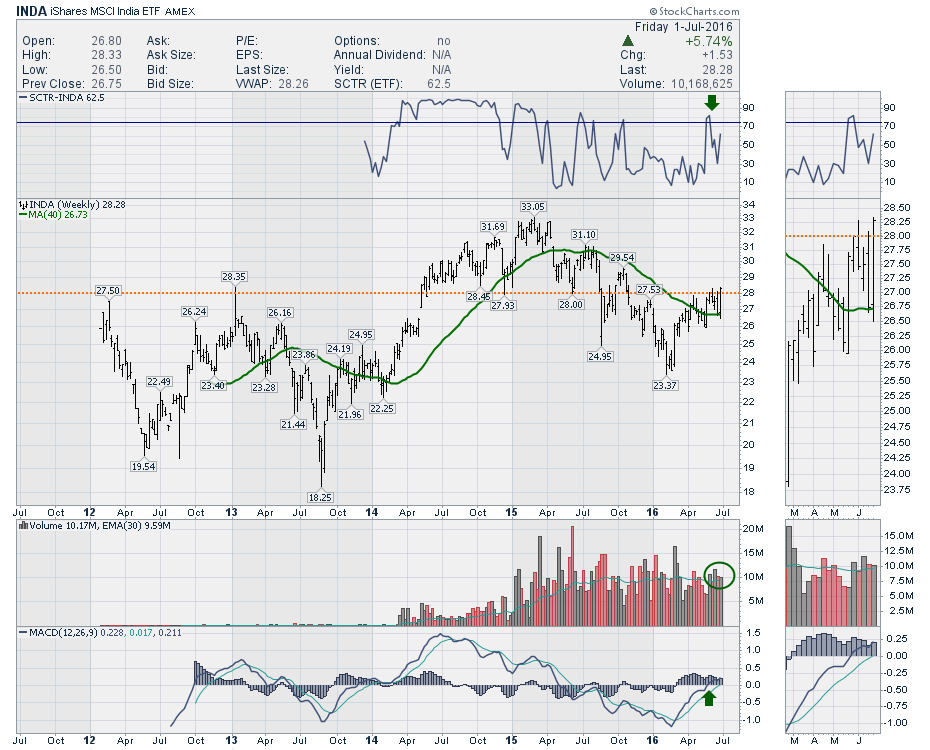 There are all sorts of technical patterns including back-to-back outside weeks and a 9-month Head/Shoulders base with a neckline at $28. We are currently bouncing off an upsloping 40 Week MA which is a technical favorite. Finding support at the 40 WMA after being below it for a long period is a good technical signal. With the volume over the last month coming in slightly above average every week, that is a good sign of interest.
This can be invested in a variety of ways. You can see there are 3 ETF's with an SCTR above 75 already in India. I chose a high volume ETF that had an SCTR in the middle of the top three volume ETF's just to illustrate the idea. I recommend looking a little deeper in India to see if there is a chart that interests you there. Amidst all the gloom around the world, the demographics in India are great. Any time the India chart looks bullish, I want to be onboard.
Good trading,
Greg Schnell, CMT, MFTA