What a surreal experience it was waking up on Thursday morning. Switching on the news and seeing that Russia has actually invaded Ukraine. For us Europeans, wars since WWII have always been fought far away from home in Afghanistan, former Yugoslavia, Iraq, Iran, Kuwait, etc. But this is literally in our backyard on the Eastern border of Europe.
And although Ukraine is not a member of NATO, it's damn close...
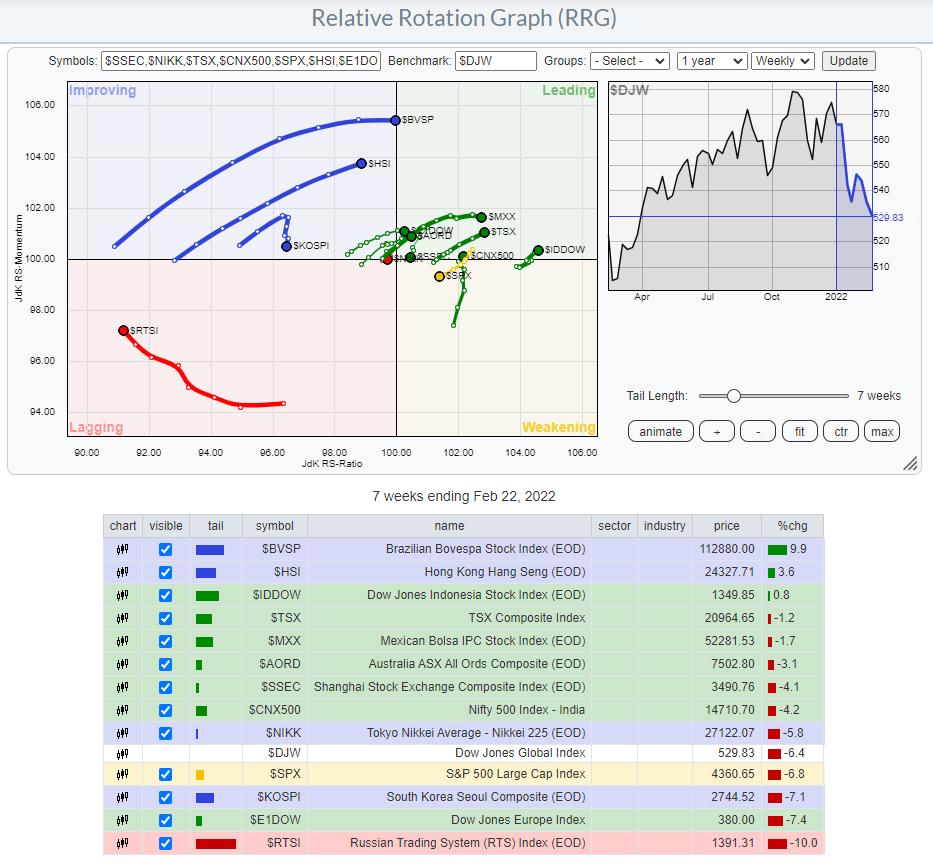
US Stocks Are Weakening vs Rest Of The World
In last week's episode of Sector Spotlight, I already had taken a quick look at foreign markets, mainly to see if there were/are any alternatives to the US market, which was and still is in a corrective pattern.
When we start by looking at the rotation of SPY vs the Dow Jones Global Index ($DJW), we find its tail inside the weakening quadrant and heading lower on both axes, resulting in a negative RRG-Heading.

The only other markets that have tails at a negative RRG-Heading are Korea ($KOSPI), Japan ($NIKK), and China ($SSEC). Looking at the world from a bigger perspective, these are the markets that are currently better avoided, as they are exhibiting negative relative trends.

All other tails in this universe are showing tails at a positive RRG-Heading, except for Russia ($RTSI) inside the lagging quadrant.

War is Damaging Russian Stock Market
Isolating the tail for Russia shows the deterioration starting in the last weeks of November and picking up speed at the start of November, subsequently rapidly pushing into the lagging quadrant. Over the last few weeks, the Russian tail has crept up on the RS-Momentum scale while still losing relative strength vs. the rest of the world.
Given the very low reading on the JdK RS-Ratio scale, the distance from the center, and the disconnect from other markets, it is very unlikely that this rotation will be the start of a long-lasting improving rotation. A more likely scenario will be a rotation on the left-hand side of the RRG, underscoring the weakness of the $RTSI.

The monthly chart of the $RTSI index shows how much damage was done to the chart this month so far. What strikes me is that the low of the month so far is pretty much exactly at the lows of 2014 and 2016 and close to, or in the area of, the bottoms in 2008/9 and 2004/5. It remains astonishing, imho, how markets seek and are attracted back to levels that were set many years ago.
We are already seeing some big bounces but, given the magnitude of the decline, these are still very limited. I'm afraid this market will need a lot of time to digest all this selling pressure. Enough reason, among others, to pass on investments in Russia for the time being.
Alternatives?
Of course, especially for retail investors, cash is an alternative. But if you would like to keep some allocation to stocks, it is a good idea to broaden your horizon outside the US.
The third RRG above, showing the tails that are traveling at a positive RRG-Heading, provides you with possibilities that are worth a further investigation. Going over their individual charts, I found two markets that may offer an alternative to the US.
Indonesia

On the Relative Rotation Graph, $IDDOW has the highest reading on the RS-Ratio scale and has just returned into the leading quadrant after a rotation through weakening. This makes it an interesting tail to look at. Bringing up the price chart for the Indonesian stock market shows that $IDDOW has just broken from a short consolidation pattern and is now pushing against falling resistance, which is running over the major highs of the last four years.
The RS-line has already taken out its overhead resistance level after breaking its falling resistance back in October of last year. This puts Indonesia at the forefront of international stock markets; a break above resistance in the price chart will very likely add more fuel to the (relative) rally.
Canada

In line with other international stock markets, the Canadian TSX index started to move more or less sideways at the end of last year. But it did not complete a topping formation. Not yet, that is, as a break below horizontal support near 20000 would damage the picture in terms of price.
Like $IDDOW, $TSX has also completed a rotation through weakening, re-entering the leading quadrant six weeks ago. Especially with the increasing RRG-Velocity, this is an interesting tail/market to watch, as it seems poised to push higher on a relative basis. The current strength of commodities, especially energy-related, will be a good push in the back for this index.
Stock markets, in general, remain vulnerable. Indonesia and Canada may offer (relative) alternatives. As a US-based investor, the iShares MSCI Indonesia ETF (EIDO) and the iShares MSCI Canada (EWC), both quoted in USD, are instruments that can be used to create exposure to these markets.
Please remember that they are quoted in USD, so the currency exchange rate between the Indonesian rupiah and the US dollar, as well as the Canadian dollar vs. the US dollar, will affect performance. With the current strength of the USD vs. most other world currencies, this may actually be an additional source of performance.
Have a great weekend and #StaySafe, --Julius
My regular blog is the RRG Charts blog. If you would like to receive a notification when a new article is published there, "Subscribe" with your email address.
Julius de Kempenaer
Senior Technical Analyst, StockCharts.com
Creator, Relative Rotation Graphs
Founder, RRG Research
Host of: Sector Spotlight
Please find my handles for social media channels under the Bio below.
Feedback, comments or questions are welcome at Juliusdk@stockcharts.com. I cannot promise to respond to each and every message, but I will certainly read them and, where reasonably possible, use the feedback and comments or answer questions.
To discuss RRG with me on S.C.A.N., tag me using the handle Julius_RRG.
RRG, Relative Rotation Graphs, JdK RS-Ratio, and JdK RS-Momentum are registered trademarks of RRG Research.