The Month of October was a surge to remember in US markets. It was not quite as strong in other parts of the world, but it was a rising tide. Here are a few of the charts discussed in the webinar. You can click here to watch the webinar. Commodities Countdown Webinar.
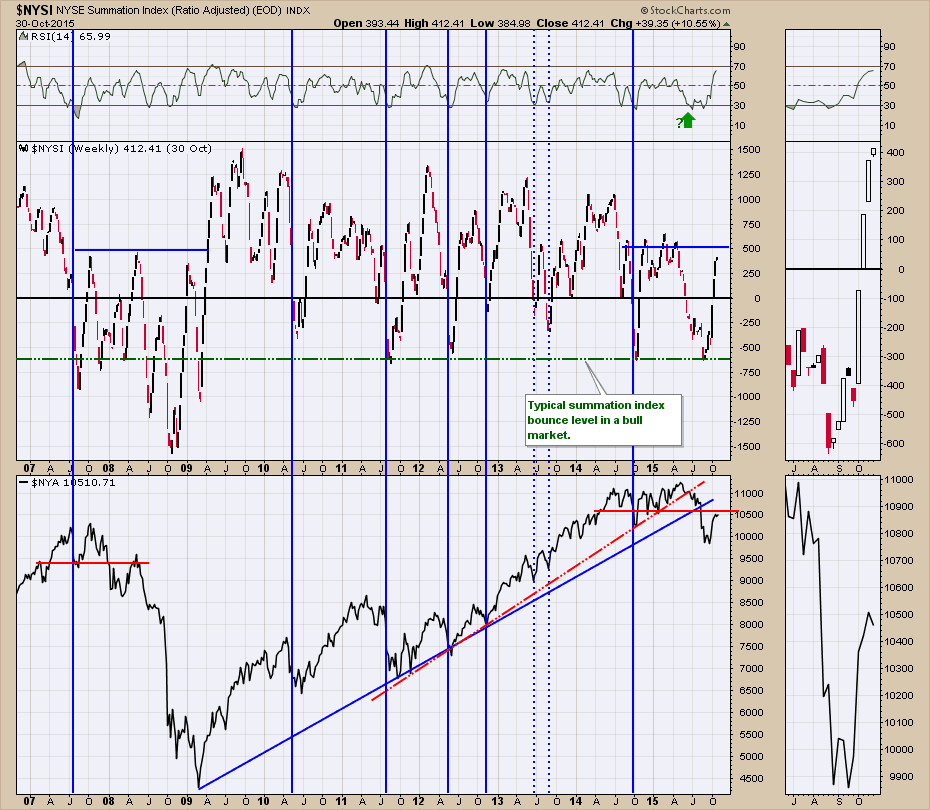
First of all, the NYSE Summation Index. ($NYSI). In the top panel, you can see the Summation index has traveled in the same range as it did in 2007-2008 period. We are looking for a strong acceleration above 600 to really suggest the next leg of the bull market is ready to go higher. As you can see this is an important level. The current market rally in the New York Stock Exchange Composite($NYA) in the lower panel looks very similar to the 2007 topping structure. After pulling back significantly below support, the $NYA is currently sitting at what was support and is now resistance. This is similar to 2007 so far.
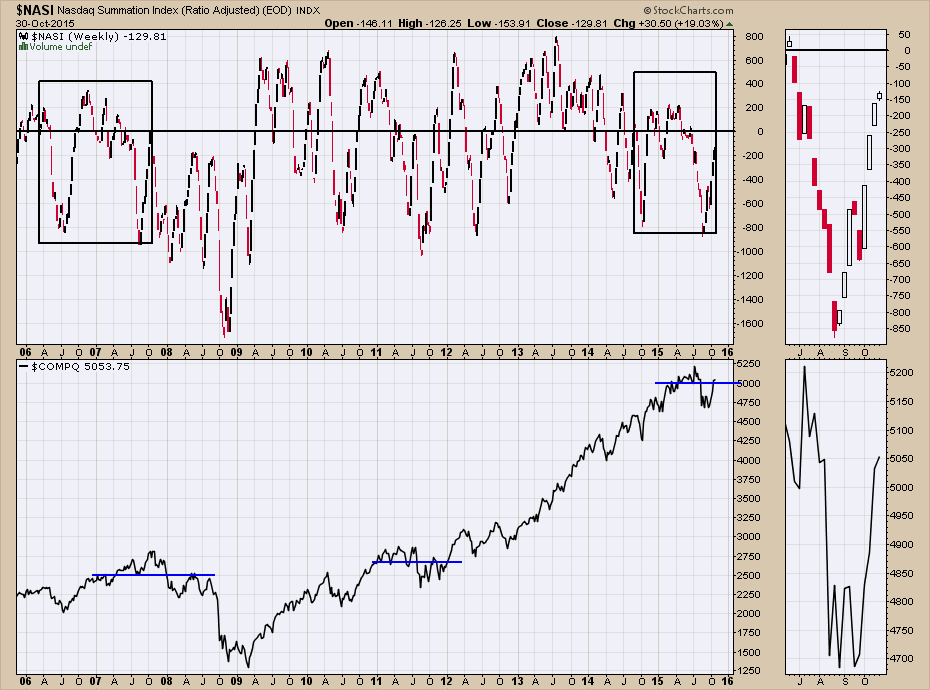
For the Nasdaq Composite ($COMPQ), the summation index is the $NASI. Notice how the -200 level was a ceiling in 2008. We are currently at that level now. If the $COMPQ was to go on to a new high, the historical view shows zero as a $NASI limit on the final high. Over the past year, the $NASI has not been able to reach escape velocity and has stalled around 200. We have just entered the area of interest and now we'll monitor it between -200 and +200.
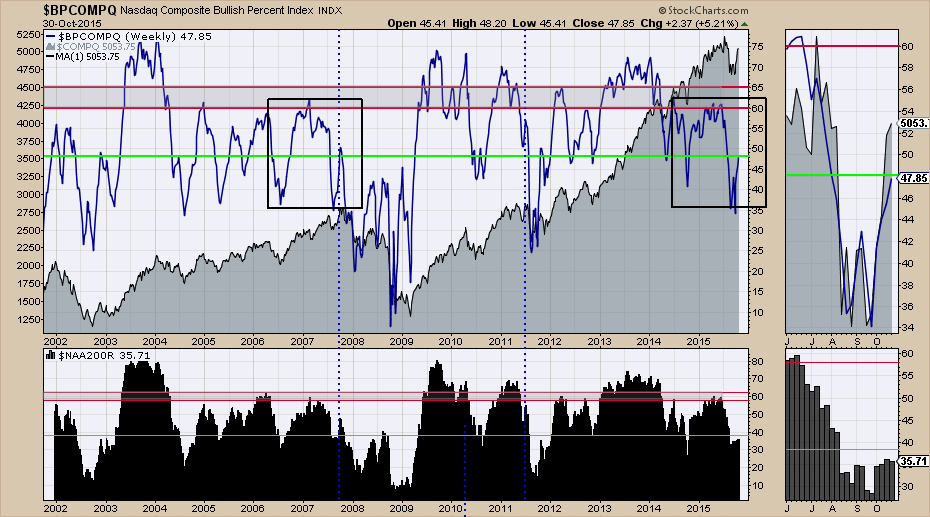
The Bullish Percent indexes have also retraced to levels seen during the 2007-2009 area. How this resolves will be a good clue and it would appear that we are at the level of finding out. The Bullish Percent Index for the Nasdaq Composite ($BPCOMPQ) is right at the level where it topped out in 2007. On Fridays pullback into the close, almost 10% of the Nasdaq stocks lost the 200 DMA from Thursday's webinar. So although the index didn't lose much, under the surface a large number of stocks fell back below the 200 DMA from 38% to 35%. If the market can find strength here, this would be the inflection point. The Bullish percent index stayed below 50% in the bear market of 2008-2009. It surged a little higher back in 2002.
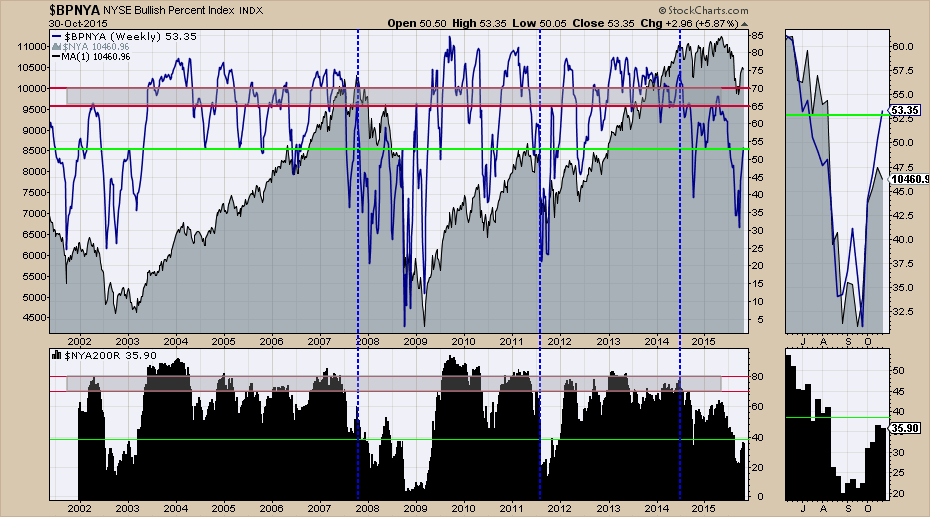
The $BPNYA looks very similar to the signature during the market top back in 2007-2009 with plunging lows to 35% which is lower than the bull market levels of 50%. Looking at the level of 53%, it could be typical of a bear market rally from oversold lows. We need this to rally back up to the 65-70% level to reinvigorate the Bullish Percent Index. The number of stocks below the 200 DMA ($NYA200R) shown in the bottom panel is also quite weak. The market was also this weak in 2011 and that marked a major low. These very depressed levels were part of major bear markets in 2001-2003 and 2007-2009. The rally in May 2008 got back up to about 45% before it rolled over. So the indicators are pointing to a decision at these levels.
The $BPSPX, the $BPNDX as well as the $BPTSE indicators are shown in the webinar. There has been a lot of discussion about this latest rally being a large cap party and the small caps were left behind. The $BPSPX and $BPNDX are both covered in the first few minutes of the webinar and have similar signatures to 2007-2008. The "Bullish Percent" readings for these 'Large-Cap' indexes are affected by ETF buyers so the bullish percent indexes make it to much higher levels, even in bear markets. They are testing those levels now. You can click here to see that. Commodities Countdown Webinar 20151029.
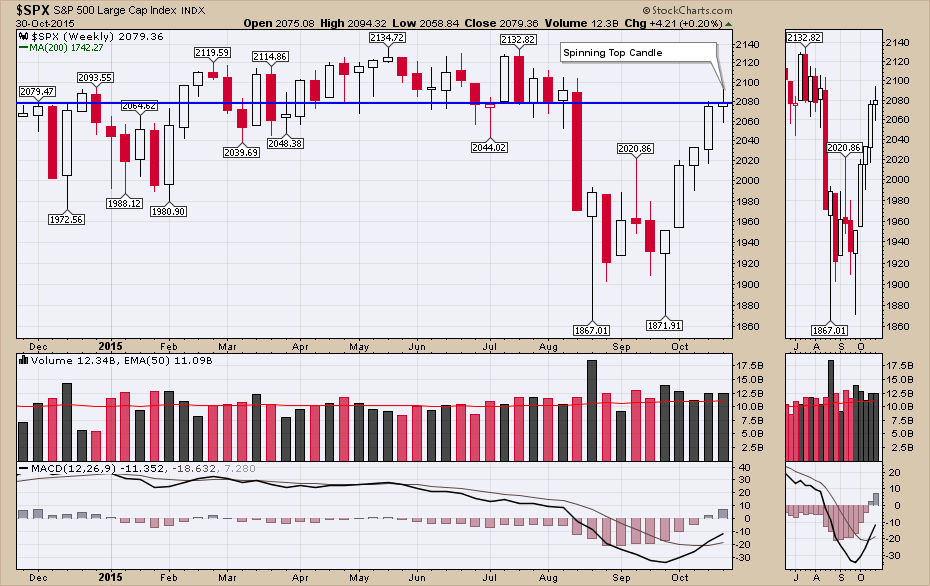
We have been watching the 2060-2085 area for the month as a target area and to see what happens once we are there. This week we made it to those levels. After breaking above 2080, the market had a doji day on Thursday and then closed Friday back at 2080. That price action makes this level more important. The line shown has been on this chart for months. On the webinar, I showed a weekly version.
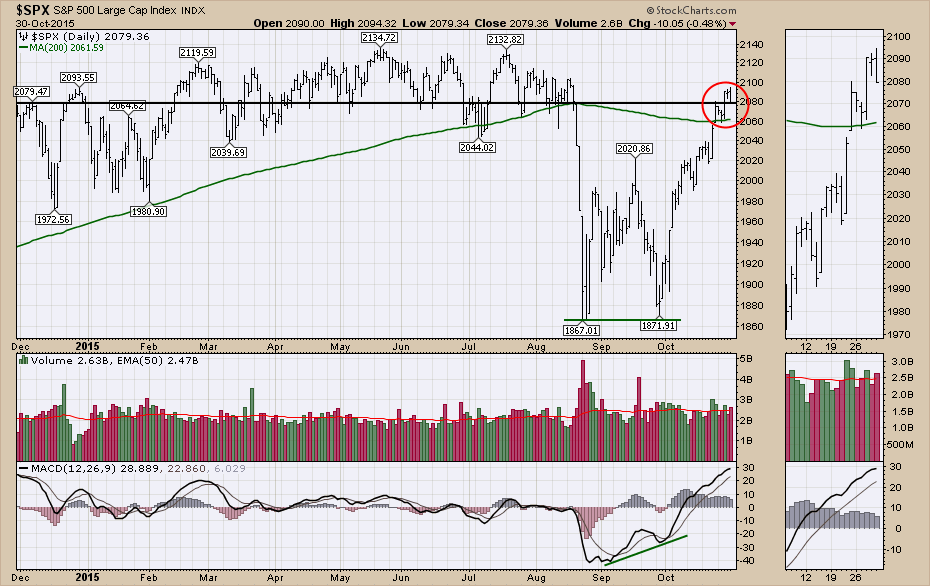
The weekly candle was much smaller than the previous few weeks. Considering the level of 2080 has been so important, it would have been nice to just roar through. Even with the Fed meeting, the market made very little progress so it still suggests to me to be on the cautious side as the MACD is still below zero.
I covered off the Russell 2000, $TSX, $SSEC, $NIKK, $HSI in the webinar. Commodities Countdown Webinar 20151029
I roared through the commodities on the webinar. Oil traded up on the week, Gold and Silver traded down. $NATGAS is near 12-year lows and I discussed waiting for a daily or weekly reversal depending on your time horizon. For the indexes, I think the most important thing will be watching the 2080 level for the $SPX. If the market can not close above that level this week, my expectation will be that there is not enough breadth to move higher for now. If it can, it will probably test the highs about 50 points above here on the $SPX.
Good trading,
Greg Schnell, CMT