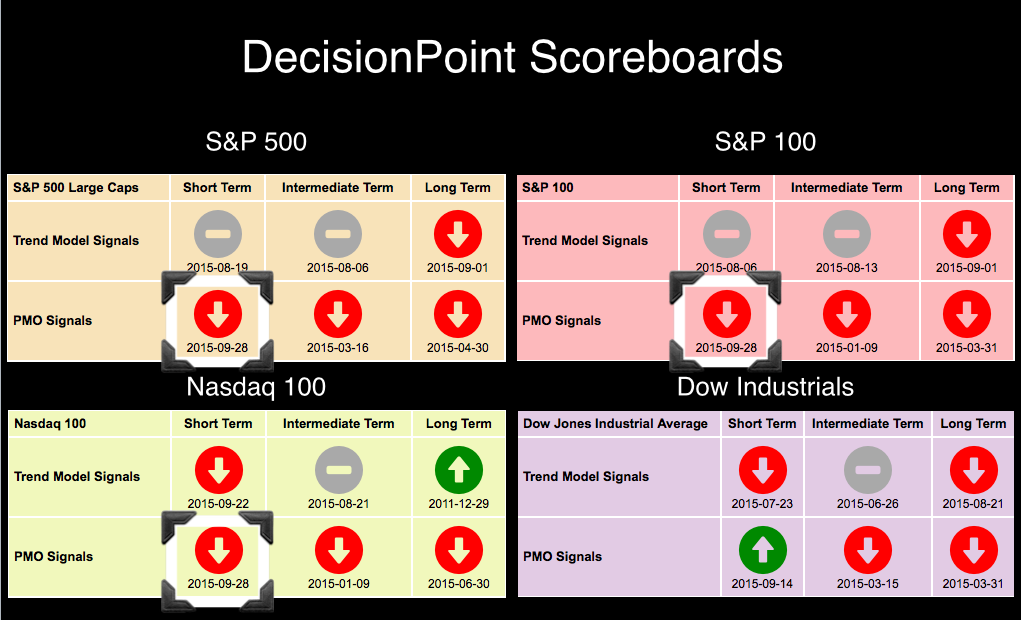
I noted yesterday that the NDX, SPX and OEX all had Short-Term Price Momentum Oscillator (PMO) crossover SELL signals. The DecisionPoint Scoreboard is below. Let's look at the crossovers and then we will discuss the NDX Long-Term Trend Model BUY signal and INDU Short-Term PMO BUY signal. Just because there are BUY signals listed, doesn't mean they are altogether bullish.
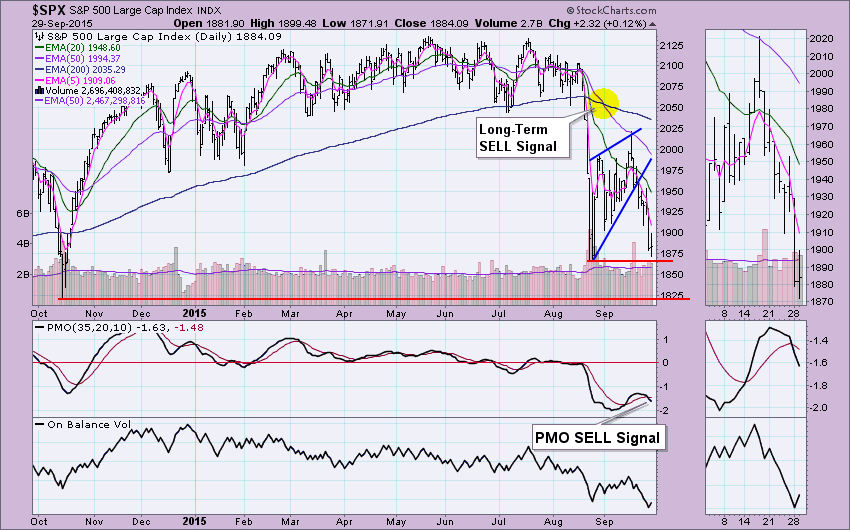
The SPX generated the PMO SELL well below the zero line which is especially bearish. While it appears in oversold territory, a longer term chart will reveal that is not the case. Of particular concern is how close price currently is to the August lows. The steep declining trend is fueling negative momentum as seen in the PMO. I wouldn't expect this to be strong enough support to a large rally. It should eventually test October lows and then we can determine the fate of this bear market.
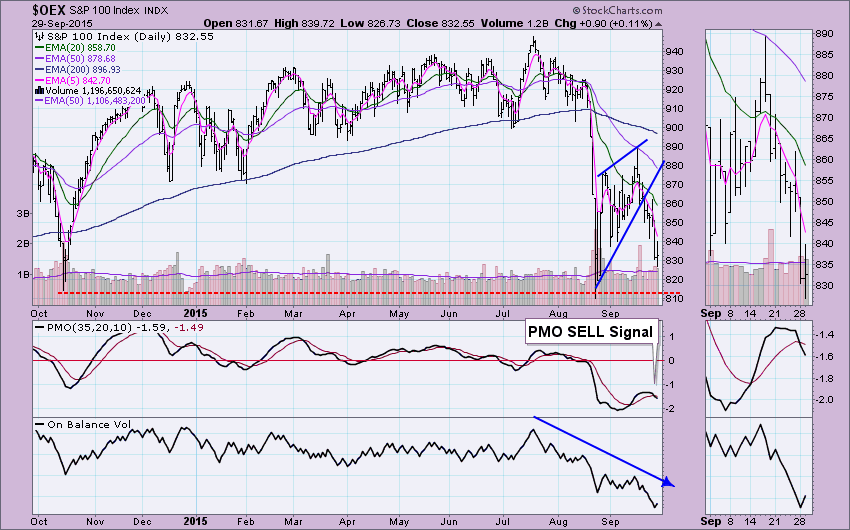
The OEX PMO crossed below its signal line generating the new SELL signal. As with the other indexes, the crossover occurred well below the zero line which is especially bearish. October and August lows coincide which normally I would consider an excellent form of support. However, price is very close to it and all other indicators point to more downside, more downside than that potential support could provide. OBV is declining which tells us that volume is supporting the decline more than the rallies.
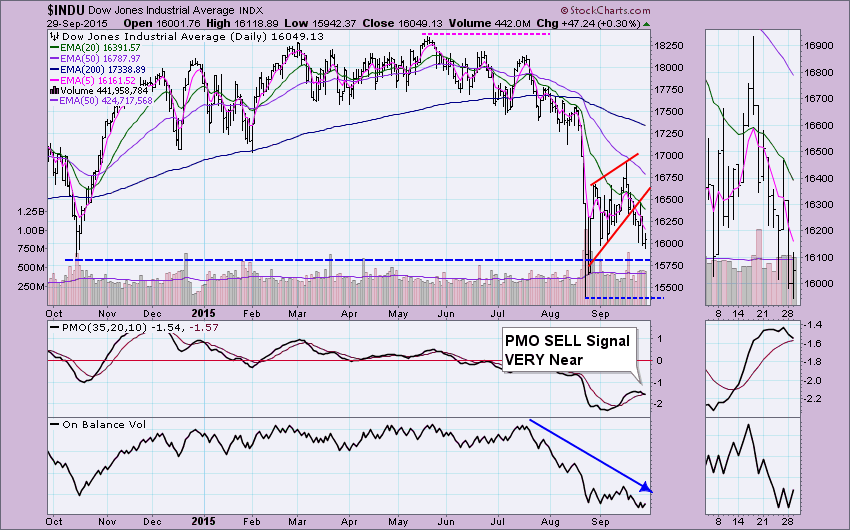
Unlike the other indexes, the Dow's October lows were not as low as the initial crash, therefore October lows will be tested shortly and likely broken. The only potential parachute is August lows which would prevent the walk off the cliff. We can see that the PMO is still on a BUY signal, as noted on the Scoreboard, but barely! I would expect this signal to fail tomorrow which would leave only one quadrant bullish, the NDX Long-Term Trend Model.
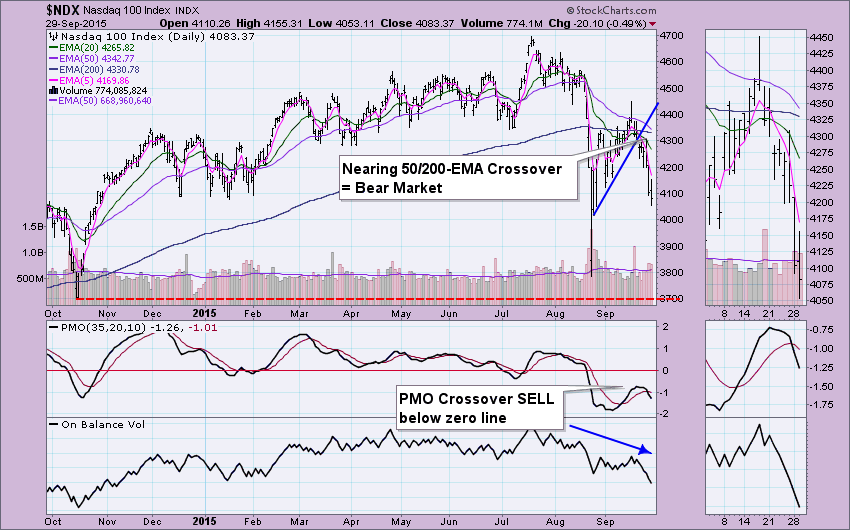
Like the Short-Term PMO BUY signal on the Dow, this negative crossover will be here very soon. The Long-Term Trend Model position is based on the location of the 50/200-EMAs. When the 50-EMA is above the 200-EMA, DP considers that issue to be in a "bull market". When the 50-EMA crosses below the 200-EMA, the issue moves to a "bear market". All other indexes had moved to "bear markets" much earlier so the NDX has some catching up to do. October and August lows are nearly the same, with the PMO SELL signal and pending Long-Term Trend Model SELL signal, I would expect this support to be tested.
Conclusion: While the signals on the DP Scoreboard do not all match completely, they will very soon. There are numerous bearish implications on all of these charts. I do not see anything bullish right now.
Technical Analysis is a windsock, not a crystal ball.
Happy Charting!
- Erin