 The iShares Commodity ETF (GSG) had a momentous BUY signal. Today, the 50-EMA crossed above the 200-EMA, reaching territory unseen since 2014. This crossover triggers a Long-Term Trend Model BUY signal that suggests GSG has entered a new bull market. A review of the charts reveals this new signal has arrived as GSG reaches a crossroad.
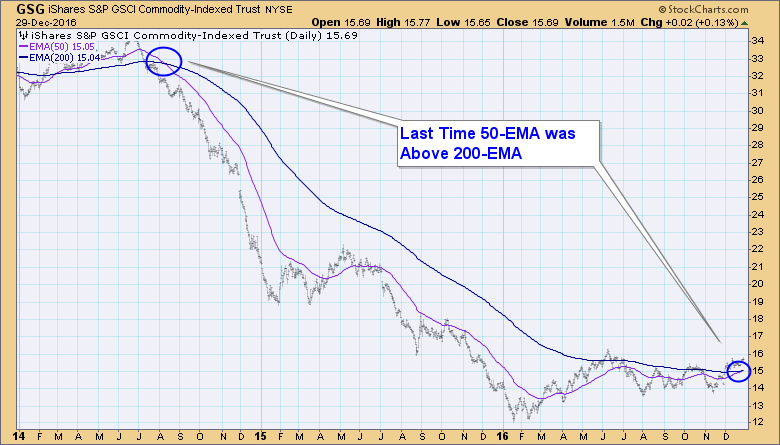
The significance of this Long-Term BUY signal is displayed in the long-term daily chart below. The DecisionPoint analysis philosophy tells us that GSG is entering a bull market (50-EMA > 200-EMA) after enduring a bear market (50-EMA < 200-EMA) of over two years.
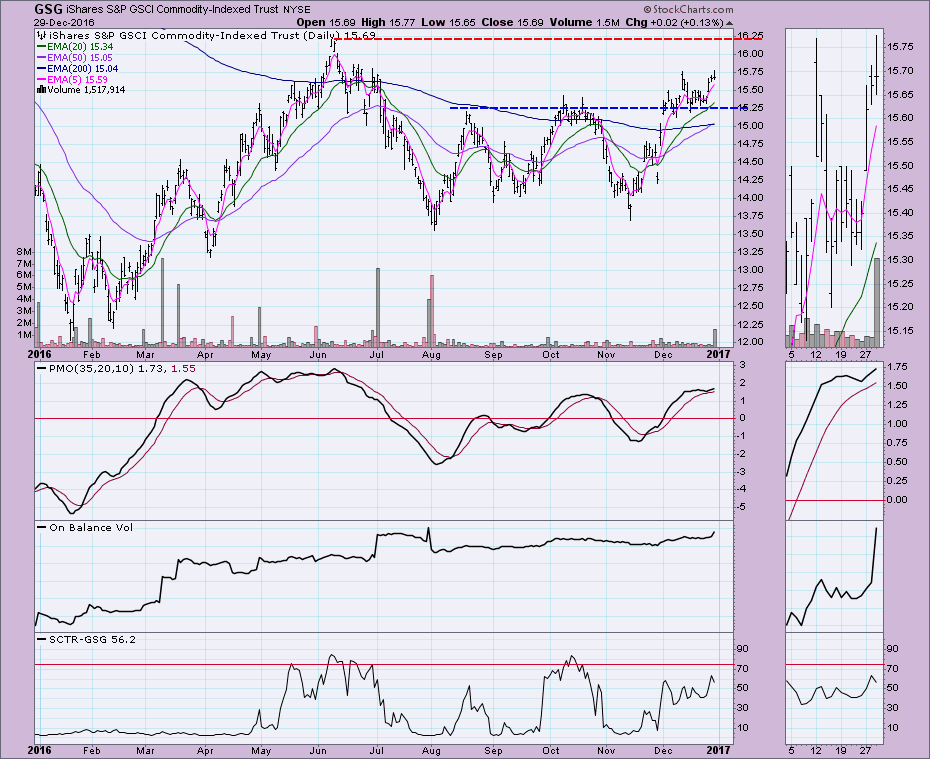
The daily chart shows GSG holding above support at $15.25. Unfortunately it hasn't been able to penetrate the $15.80 level. If it does I would look for a move to $16.25. The Price Momentum Oscillator (PMO) is in somewhat overbought territory, but it did avoid a crossover SELL signal. The SCTR is trending higher but hasn't reached the "hot" zone above 75.
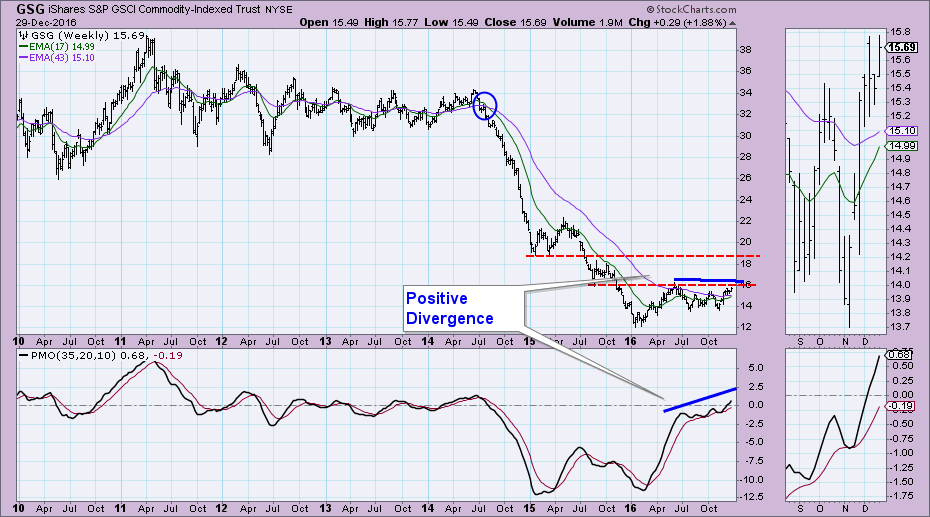
The weekly chart is very bullish. The 17-week EMA is just about ready to cross above the 43-week EMA for the first time since 2014. We can see the importance of the $16.25 resistance level. If it breaks out as the weekly PMO suggests, it has a clear path to $19.
Conclusion: The new Long-Term Trend Model BUY signal tells us that GSG has entered a new bull market. GSG has short-term potential should it be able to break above the $15.80 resistance level, for a move to $16.25. The weekly chart suggests that when the $16.25 level is broken and held, the next resistance level for price is $19.00. This may or may not happen this time around given the short-term PMO is getting overbought.
The NEW DecisionPoint LIVE public ChartList has launched! Click on the link and you'll find webinar charts annotated just before the program. Additional "chart spotlights" will be included at the top of the list. Be sure and bookmark it!
Come check out the DecisionPoint Report with Erin Heim on Wednesdays and Fridays at 7:00p EST, a fast-paced 30-minute review of the current markets mid-week and week-end. The archives and registration links are on the Homepage under “Webinars”.
Technical Analysis is a windsock, not a crystal ball.
Happy Charting!
- Erin