Biotech's have been working their way higher over the past few months and the Technical Analysts at StockCharts have been documenting the breakout. This breakout shows up in a multitude of ways. Now one of the Biotech's is on the Top 10 SCTR list.
 So the ETF that is breaking into the Top 10 is :
 This one has low volume, so we might need to trade some other ones. For the educational segment, here are the places that you can look to find these winners.
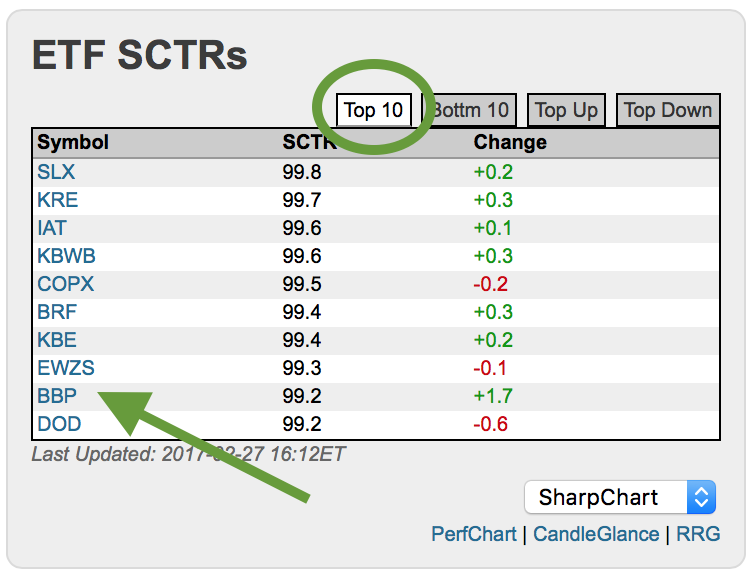
The Top 10 List shown below is from February 27th, 2016. Where is this Top 10 list? Right on the home page. Click here to find it. The home page is literally a drive-thru showing different stocks that are moving to help you find opportunities. This is the list of the top SCTR ranked ETF's over time...
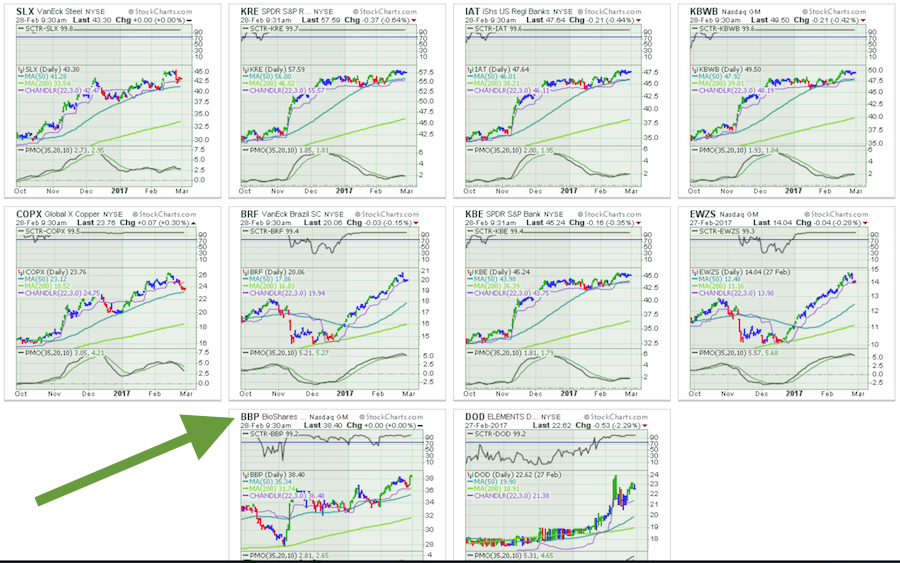
 I like to click on the RRG or the CandleGlance view down in the bottom right. As a member, you can create a custom Candleglance view. For more information on being a member, follow this link. Using my Custom CandleGlance setting, we can see all of the top ten charts at once with the data presented the way I want it. Members can watch this Video at the 53 minute mark to see how to create a Custom CandleGlance. I have adjusted my CandleGlance to show some of the features. I have an SCTR, Elder candles in red,green,blue; 6 months of data, 2 moving averages and a chandelier stop in Purple.This is just trying to display the flexibility to put whatever you want on your CandleGlance view.
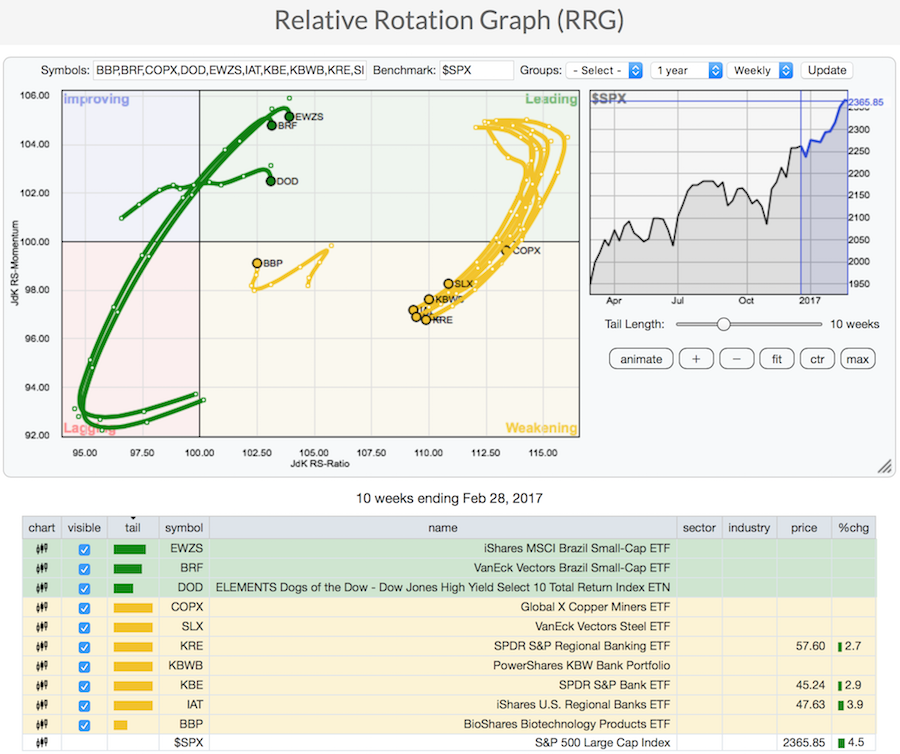
 However, sometimes the view from RRG works better. Julius De Kempenaar continues to build out the strength of RRG and using it for the top 10 is extremely helpful. We can see the Brazil related ETF's (Green) are turning down this week. The Commodity ETF's that were some of the top performers have all moved into the lagging quadrant pointing down. Importantly, so are the bank related ETF's like KRE. The BBP Biotech has rotated to pointing up and looks to be heading towards the leading quadrant once again. This is the only ETF pointing up in the top 10 so this might be a critical point in leadership change. (I wrote about the Commodities falling out of favor last week, see that article here).
 So the BBP Biotech ETF is starting to break into the top 10 and it has low volume. I don't like to trade low volume, but let's not give up on Biotech yet.
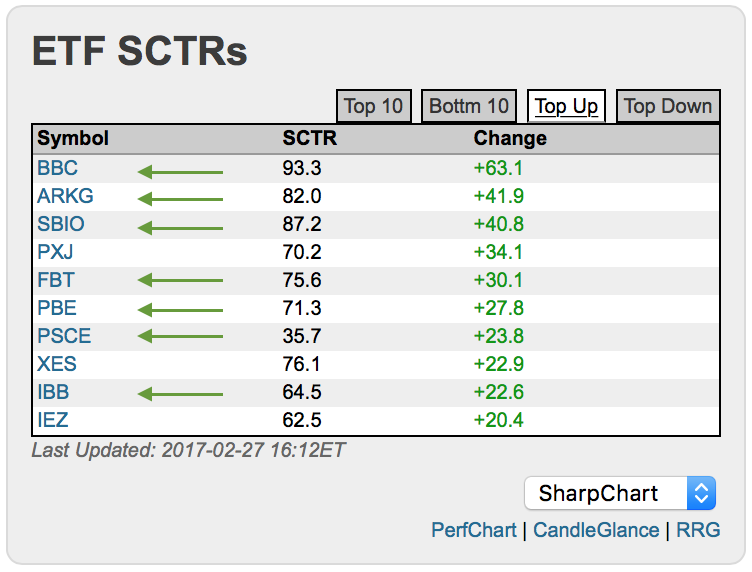
Perhaps we can look elsewhere. By clicking on the TOP UP tab we get the fast movers of the day. Seven of them were Biotech. Look closely to see the Top Up Tab instead of the Top 10 tab.
 Let's look at this list in CandleGlance and RRG view. If you set your browser width narrower, this will automatically default to 3 charts wide or two charts wide. I have done that to zoom in on the list. We can see the most of the titles. Genomics, Biotech,BioShares, Medical and the charts look somewhat similar but some differences appear. Notice the SCTR's are all accelerating to the upside and are breaking through my 75 level. That is a great entry in my work.
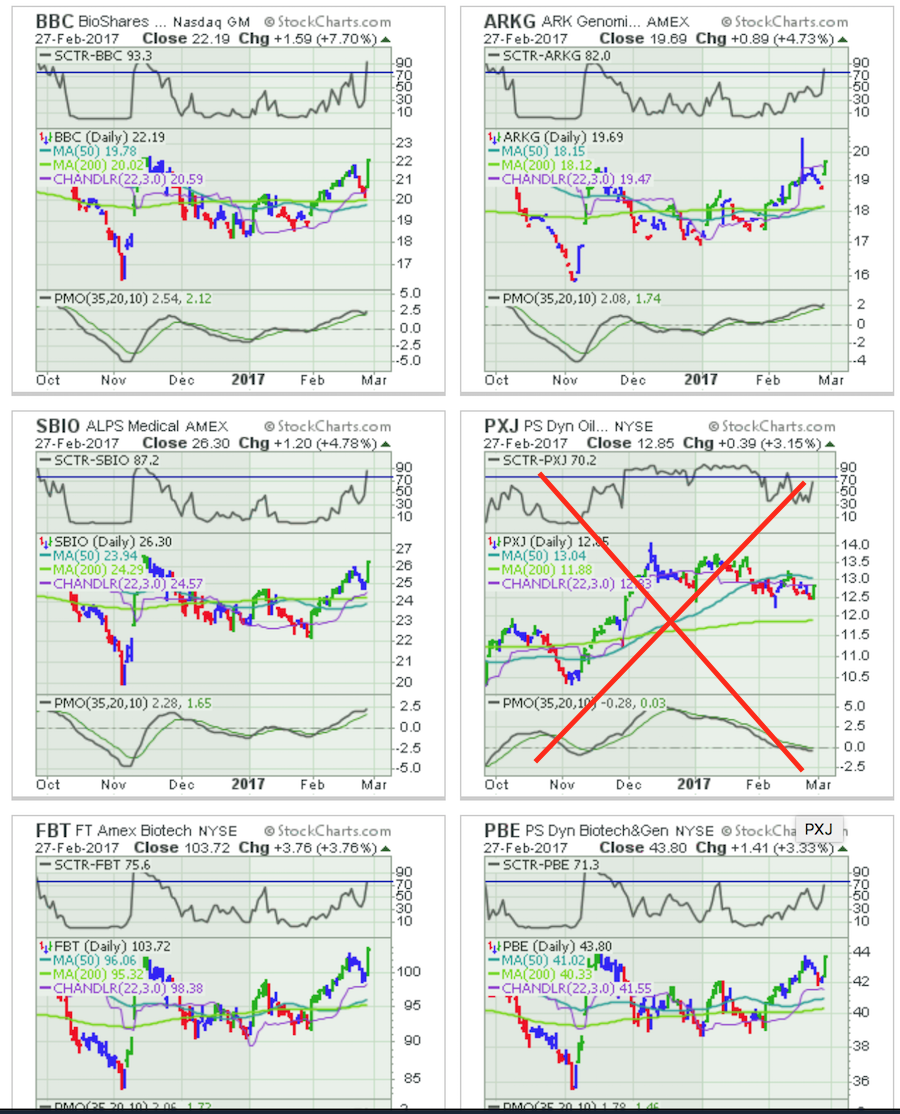
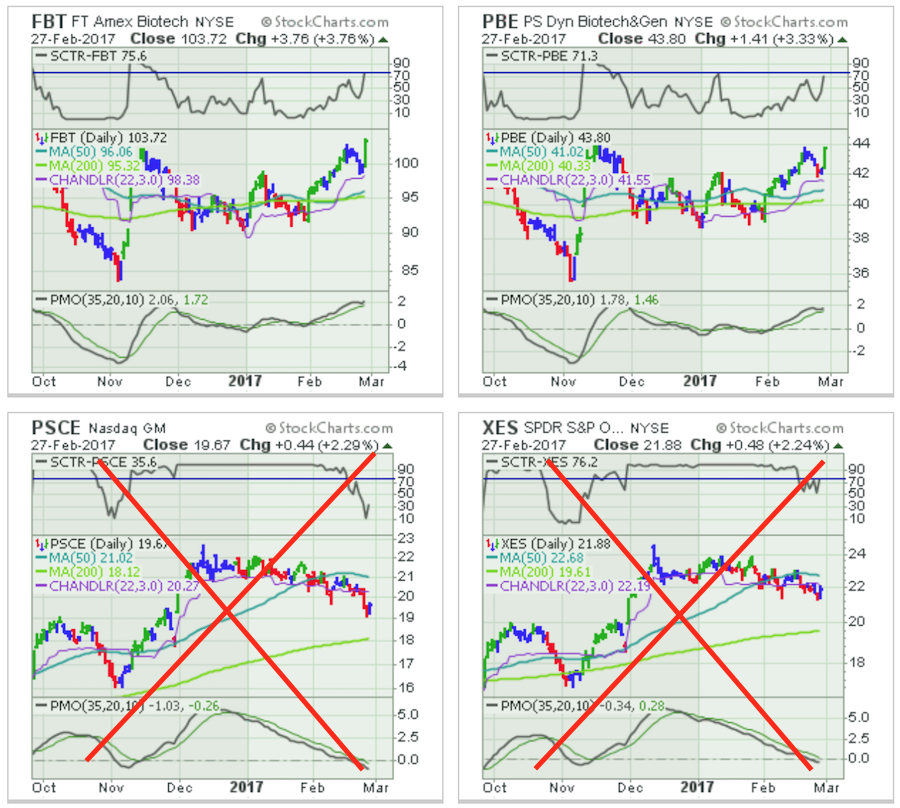 Look at the RRG chart. It tells a great story. All of the Biotechs are accelerating from lagging to improving and Julius will tell you that location is a very nice entry on the RRG. This is somewhat of a confirmation bias with different ETF provider companies having Biotech ETF's, but there are four different styles displayed including Medical Breakthrough, Genomics, Etc. Notice that the Commodity ETF's were having a good day, but the RRG suggests this is trending the opposite way. Why fight the trend? The Biotech's are emerging, and the Commodities are declining.
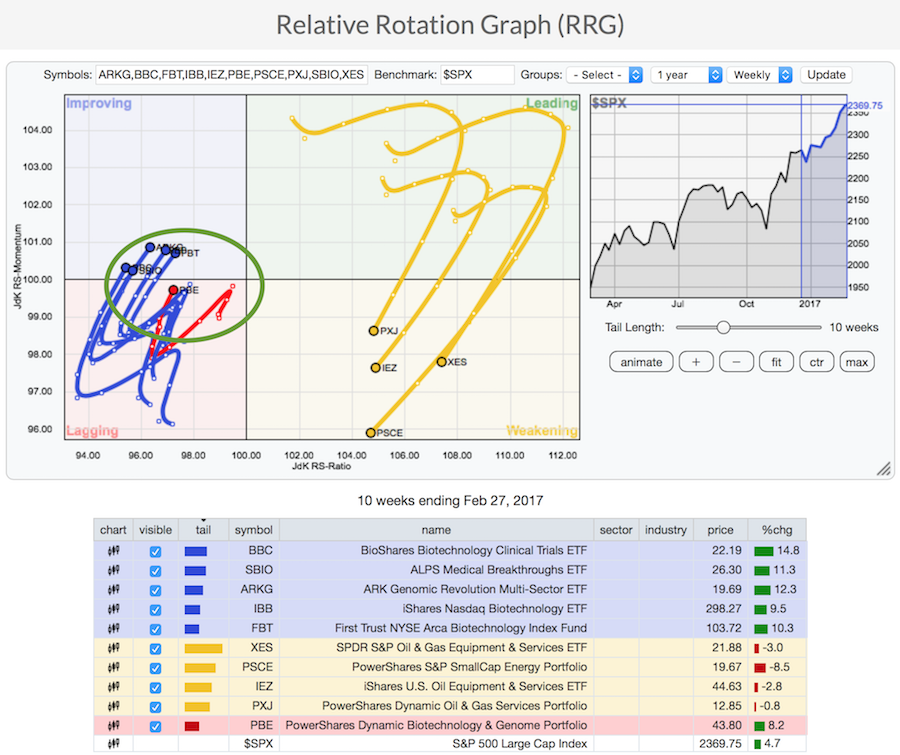
The bottom line is many of the Healthcare Biotech, Genomic, Medical Breakthrough ETF's are surging. When entire industries are moving up, this can be very beneficial to your portfolio strategy. When whole industries are moving higher, this tailwind can really help, especially if you are in the top performing stocks.
Members get the benefit of CandleGlance Views and more options on the RRG charts. Consider a membership today to unleash the power of StockCharts.com for your investment management. Click here to find out how low cost the access is to some of the world's top Technical Analysts and the Award winning website tools unique to StockCharts.com.
Good trading,
Greg Schnell, CMT, MFTA.