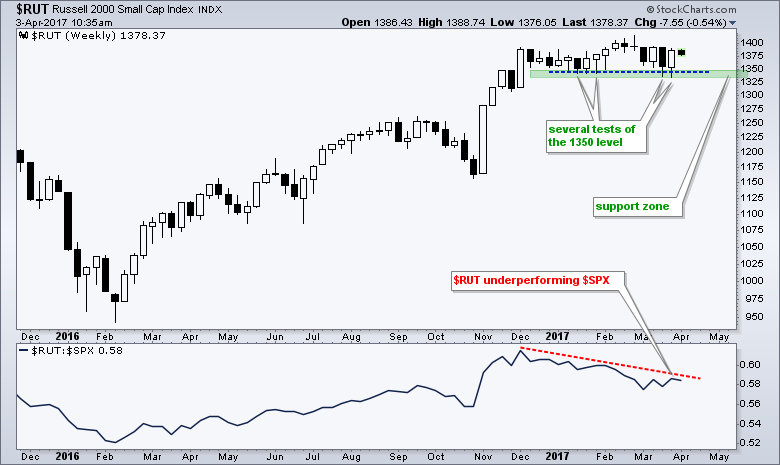
The Russell 2000 surged last week and this bounce gives chartists a clear level to watch going forward. The chart below shows the small-cap index surging from early November to early December and then stalling between 1330 and 1390 for nine weeks. The index exceeded the early December high and hit another new high with the move above 1400 in February, but this new high did not hold very long as $RUT fell back to the January lows. With last week's surge, these lows held and the 2017 lows now mark an unequivocal line-in-the-sand for chartists to watch. Being an index with hundreds of stocks, I would be inclined to add a buffer and set a support zone in the 1325-1340 area. A weekly close below 1325 would break said support zone and suggest that sellers are taking control.
****************************************
Thanks for tuning in and have a great day!
--Arthur Hill CMT
Plan your Trade and Trade your Plan
*****************************************