Don't Ignore This Chart! August 30, 2019 at 03:13 PM
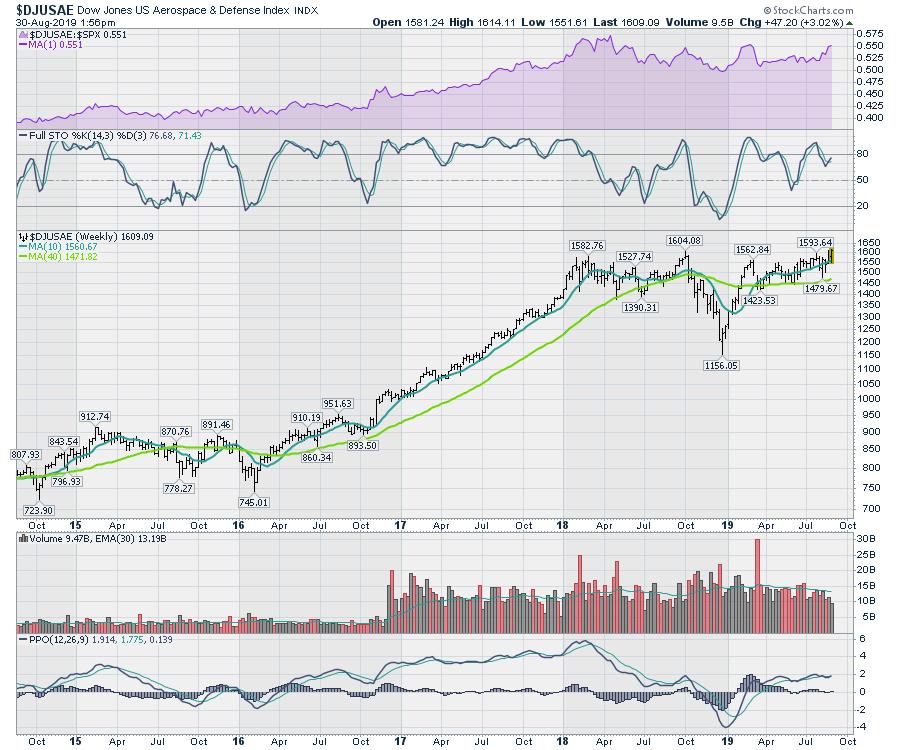
One of the industry groups that hit a new high this month was the Aerospace and Defence industry group ($DJUSAE). That chart looks beautiful. Looking through the charts in that industry group, Northrop Grumman (NOC) has been roaring higher... Read More
Don't Ignore This Chart! August 29, 2019 at 09:43 AM
Looking at the daily Relative Rotation Graph for US sectors, we can see that Consumer Discretionary is inside the improving quadrant and about to cross over into leading at a strong RRG-Heading. For the near-term, this makes XLY a sector to keep an eye on... Read More
Don't Ignore This Chart! August 27, 2019 at 09:02 PM
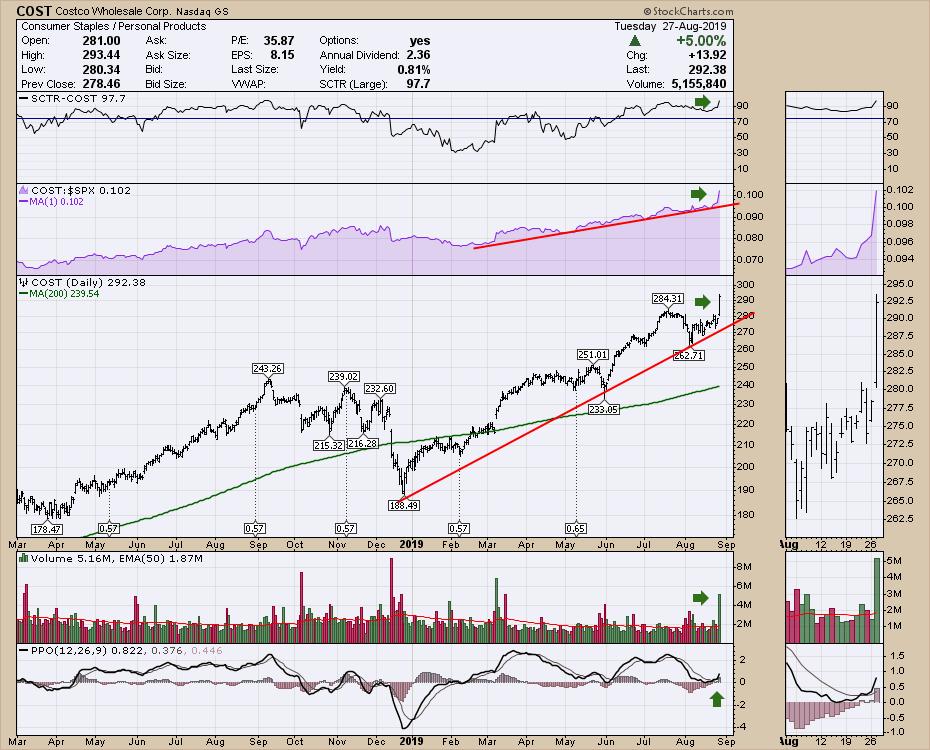
Costco (COST) continues to outpace most of the retail space with strong price action. While Tuesday was a weaker market overall, Costco, by contrast, was able to cleanly break above a small area of resistance... Read More
Don't Ignore This Chart! August 26, 2019 at 12:15 PM
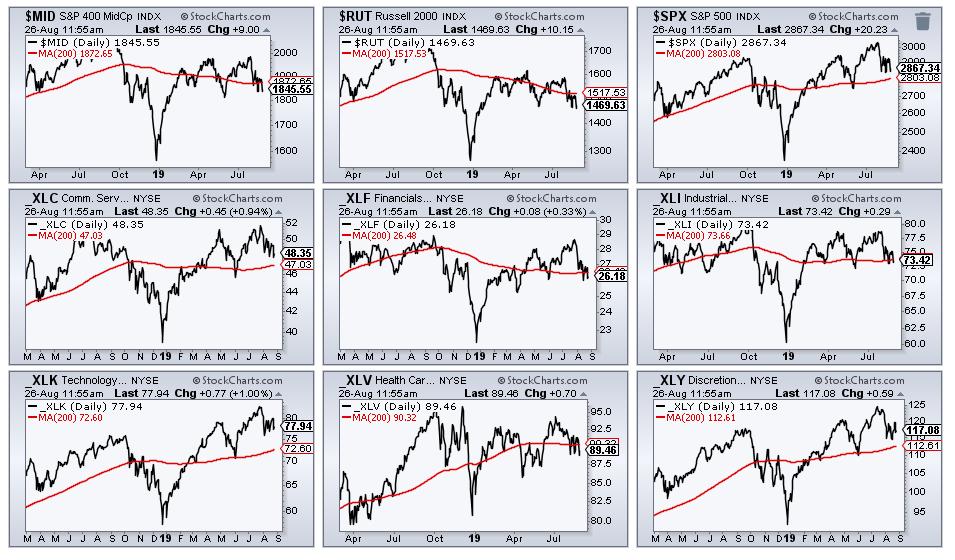
The pickings are getting slim as the broader market destabilizes. The S&P 500 and Nasdaq 100 remain above their 200-day SMAs, but the S&P Mid-Cap 400 and Russell 2000 are below these key moving averages... Read More
Don't Ignore This Chart! August 25, 2019 at 03:17 PM
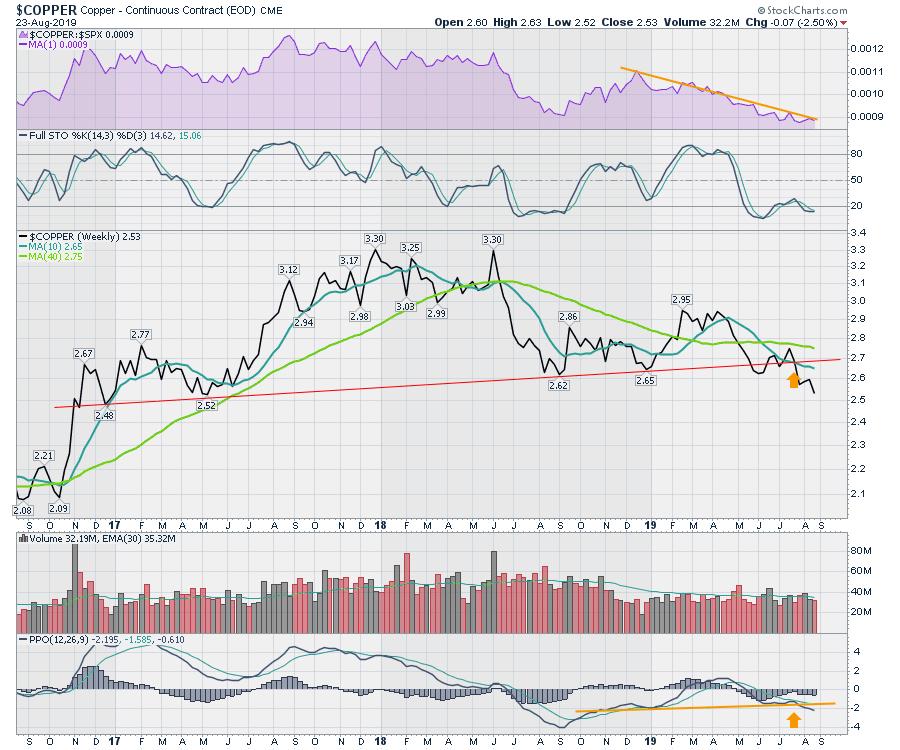
Copper continues to be an indicator of global macro trends. Like a bad movie, the plot keeps getting worse. Below is a chart of the big miners going back to November 2018. There's no magic reason for selecting that date other than it was 200 days ago... Read More
Don't Ignore This Chart! August 22, 2019 at 08:08 AM
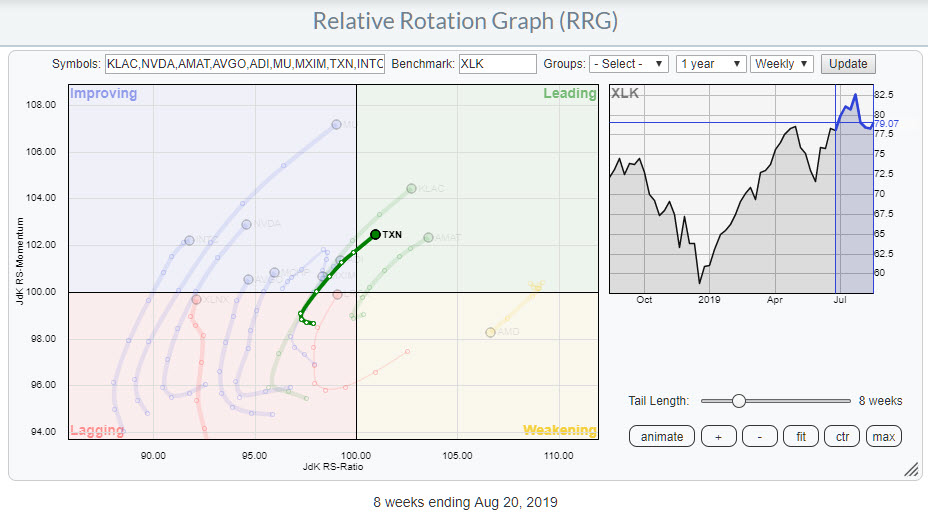
Yesterday, I wrote about the Technology sector in my RRG Charts blog, where I discussed how the semiconductor stocks as a group showed relative strength against XLK. For this DITC article, I want to work off that subset of stocks in the technology space... Read More
Don't Ignore This Chart! August 21, 2019 at 07:41 AM
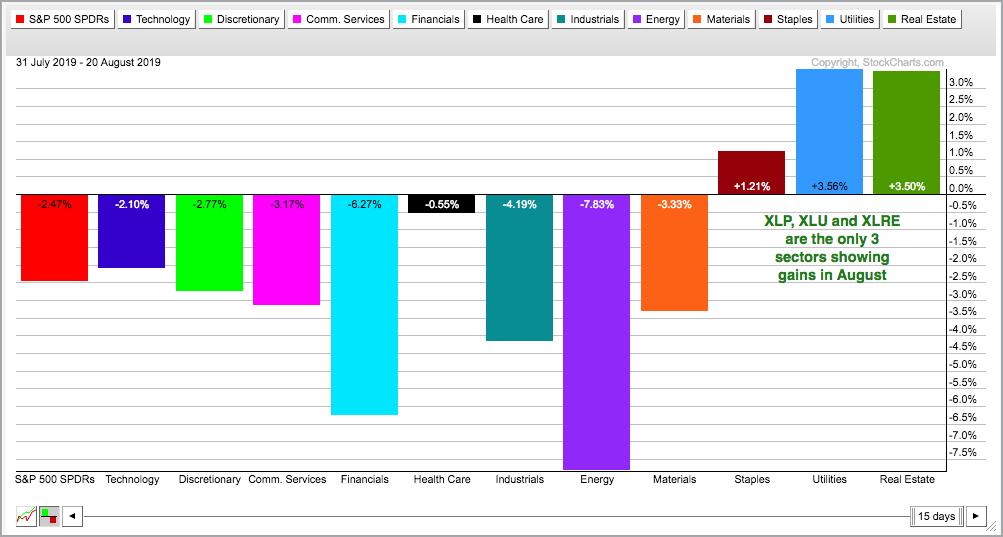
Taking a top-down approach to the stock market, we can break down the major indexes into sectors, the sectors into industry groups and the industry groups into individual stocks. There are eleven sector SPDRs and three clear leaders... Read More
Don't Ignore This Chart! August 20, 2019 at 04:13 PM
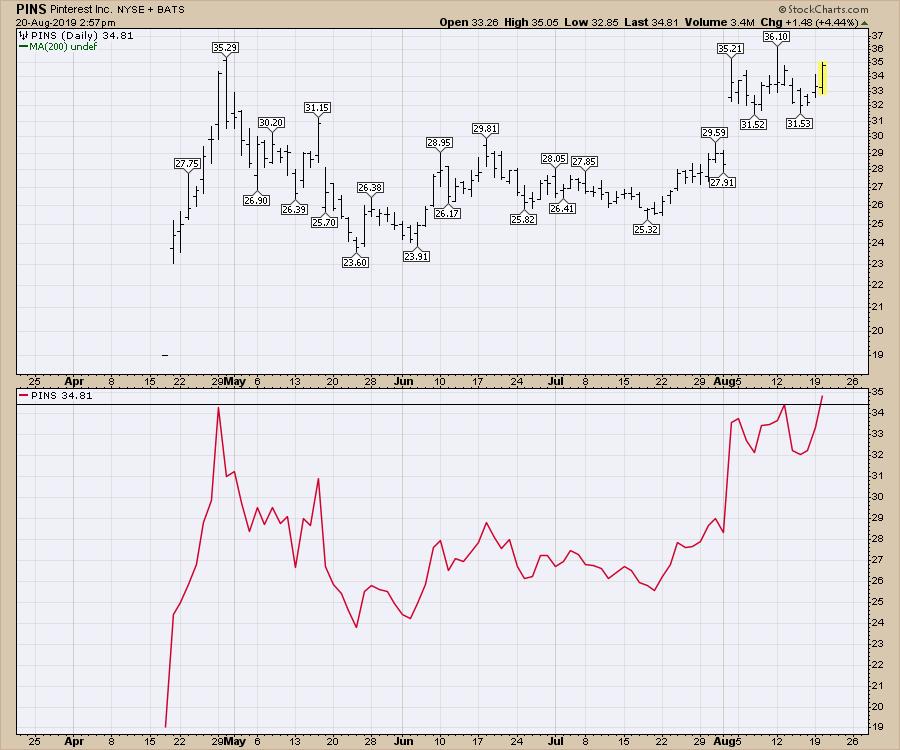
One thing about a wild ride in the indexes - it makes the breakout names so much more difficult to trade expecting followthrough. This week, one of the high-profile IPO names is breaking out to fresh highs. A close on Tuesday above $34.42 would make it the highest close... Read More
Don't Ignore This Chart! August 19, 2019 at 12:21 PM
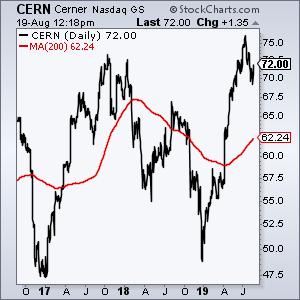
Some stocks fit nicely into sectors and industry groups. And some don't. Cerner (CERN) is part of the Health Care SPDR (XLV), but it is really a technology stock that serves the healthcare industry... Read More
Don't Ignore This Chart! August 16, 2019 at 03:59 PM
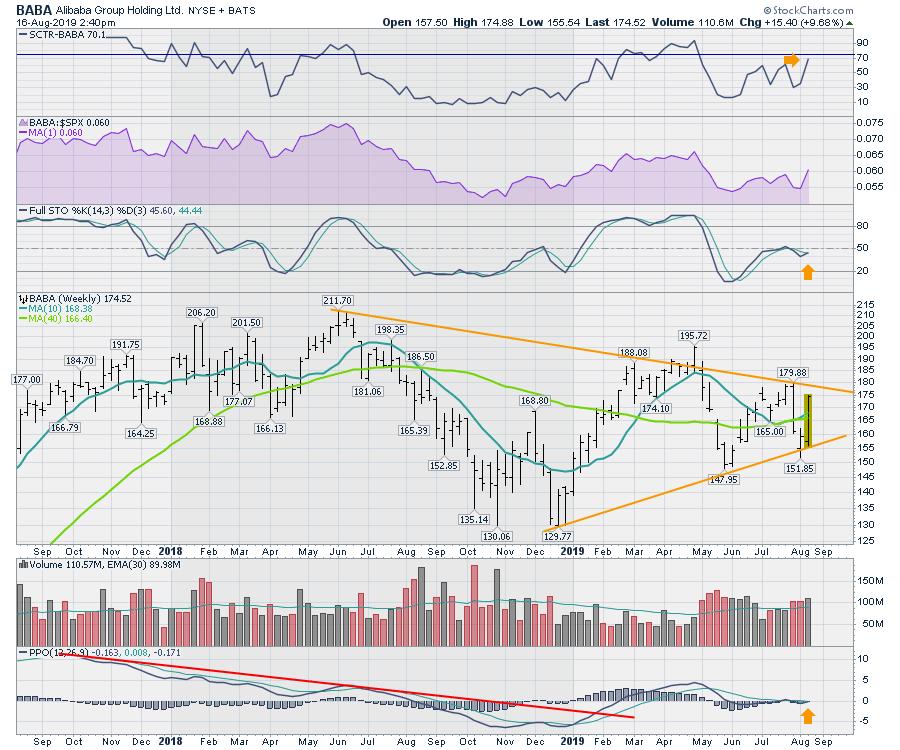
It has been 1.5 years since the tariff discussion started and the US market is broadly flat. While looking around for clues as to what to do next, I noticed some of the stocks in the Chinese large cap growth names are setting up for a potential breakout... Read More
Don't Ignore This Chart! August 15, 2019 at 07:42 AM
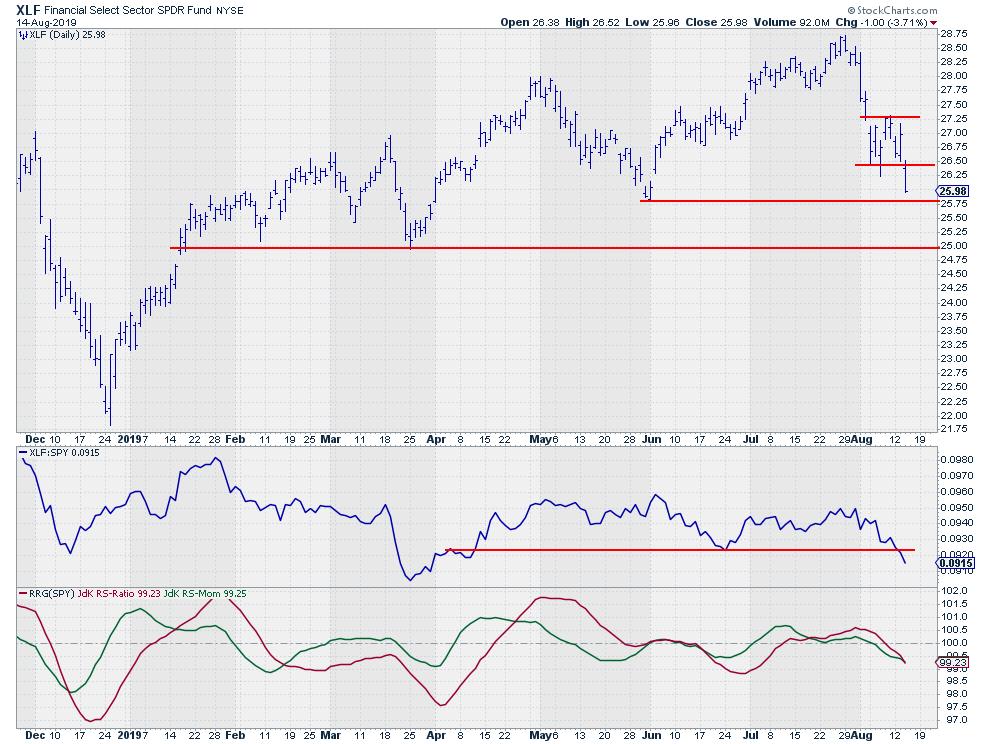
On the Relative Rotation Graph for US sectors, the tail on XLF, the Financials sector, caught my eye this morning... Read More
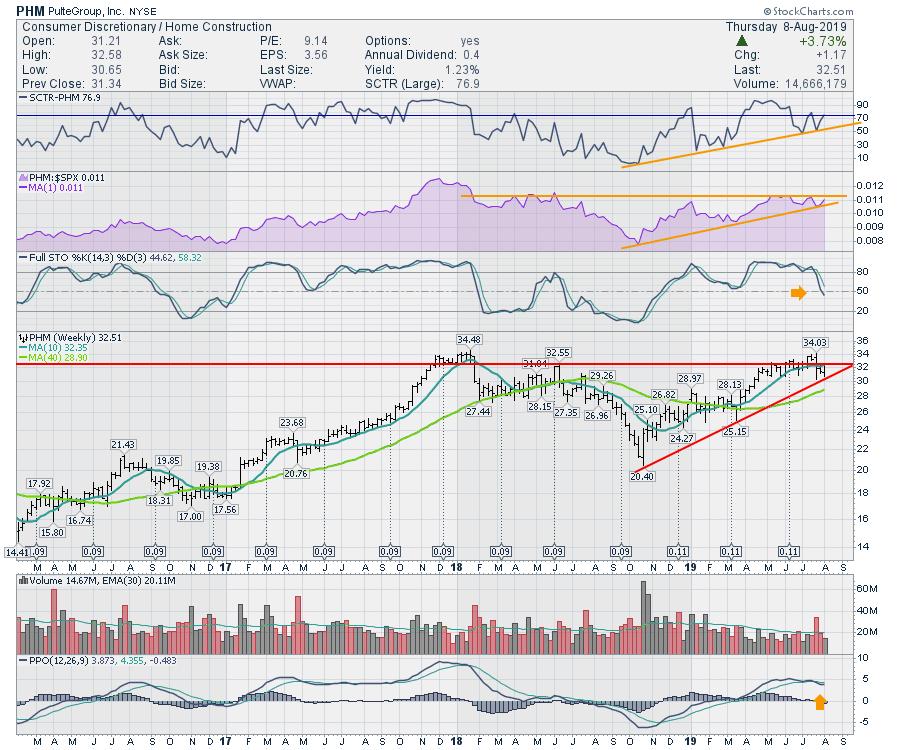
Don't Ignore This Chart! August 14, 2019 at 09:02 AM

The Russell 2000 iShares (IWM) has been underperforming for some time now and remains the weakest of the major index ETFs. The chart below shows IWM forming a lower high from May to July and a lower low from March to May... Read More
Don't Ignore This Chart! August 13, 2019 at 05:26 PM
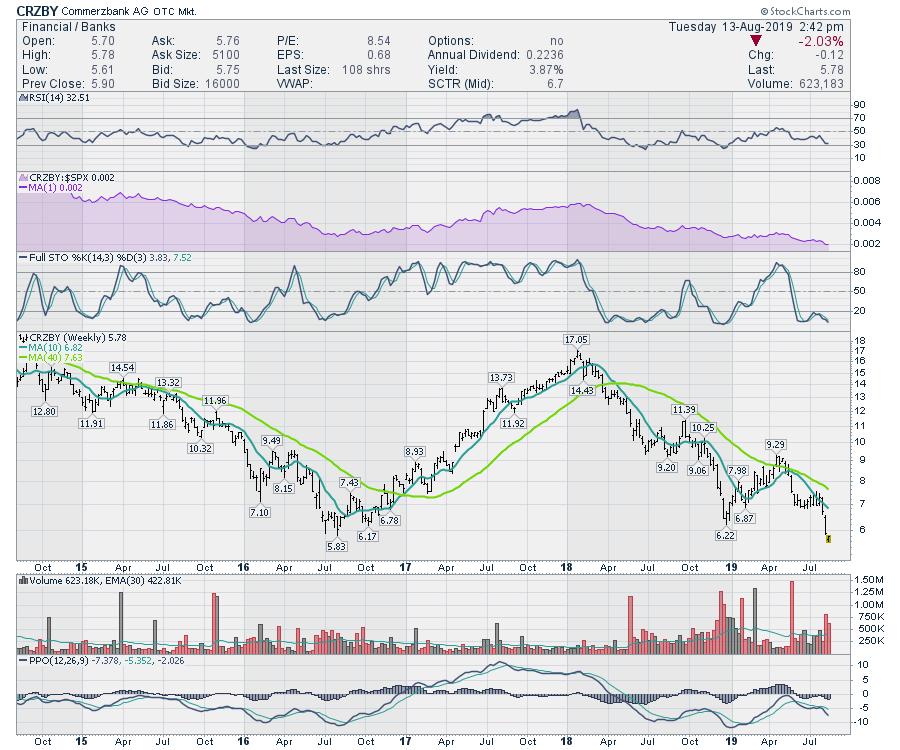
On yet another day where a tweet sends the market across a 600-point range in seconds, figuring out the true compass direction is difficult... Read More
Don't Ignore This Chart! August 12, 2019 at 08:38 AM

If you can keep your head when all about you are losing theirs ....Rudyard Kipling The line above comes from the Poem, "If" by Rudyard Kipling. We can rephrase this when looking at stocks over the last few weeks... Read More
Don't Ignore This Chart! August 09, 2019 at 12:59 PM
After such a sudden swing down, who would be surprised if we whipped sideways for a bit? With the 1000-point move down and back up on the $INDU over the past few days, would anyone be shocked that the next direction is difficult? We have lots of reasons to be concerned... Read More
Don't Ignore This Chart! August 08, 2019 at 07:24 AM
A good way for you to check what has been driving a particular market is to go to the "Market Movers" widget on your dashboard and select the universe that you are interested in. To the right, I have printed the table showing the top 10 most active stocks in the S&P 500... Read More
Don't Ignore This Chart! August 07, 2019 at 10:04 AM

Stocks were hit hard in August with the S&P 500 SPDR (SPY) moving below its 50-day line and mid July lows. Stocks and ETFs that did not break their 50-day lines and held above their mid July lows are showing relative "chart" strength... Read More
Don't Ignore This Chart! August 06, 2019 at 01:14 PM
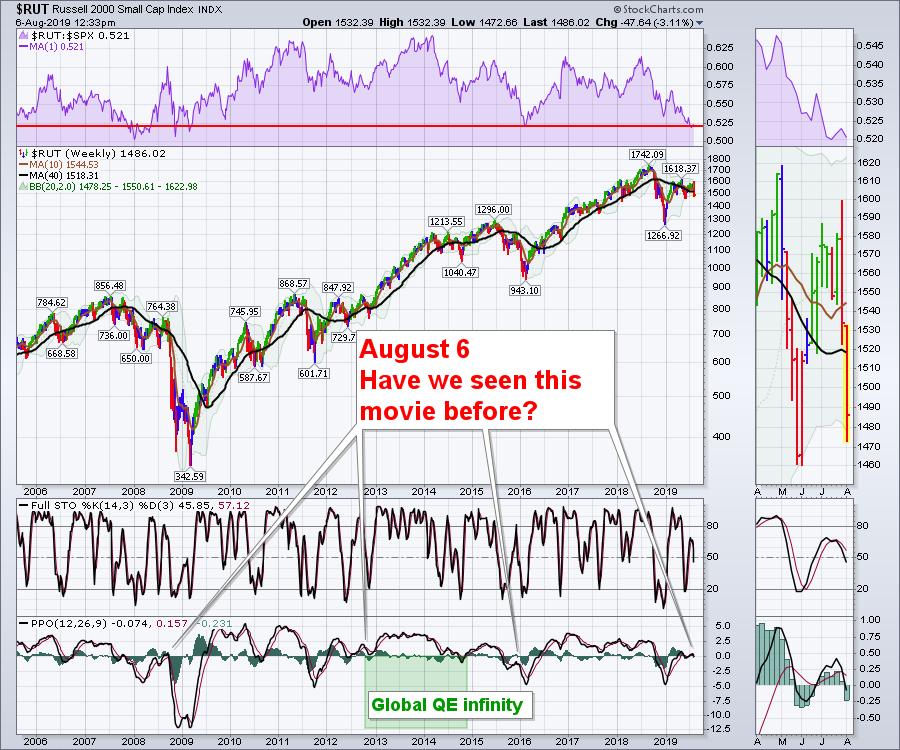
The Russell 2000 has been weakening. Everyone says it doesn't matter, but at least put it on the radar to ballast the opinion. Price is fact... Read More
Don't Ignore This Chart! August 05, 2019 at 10:54 AM
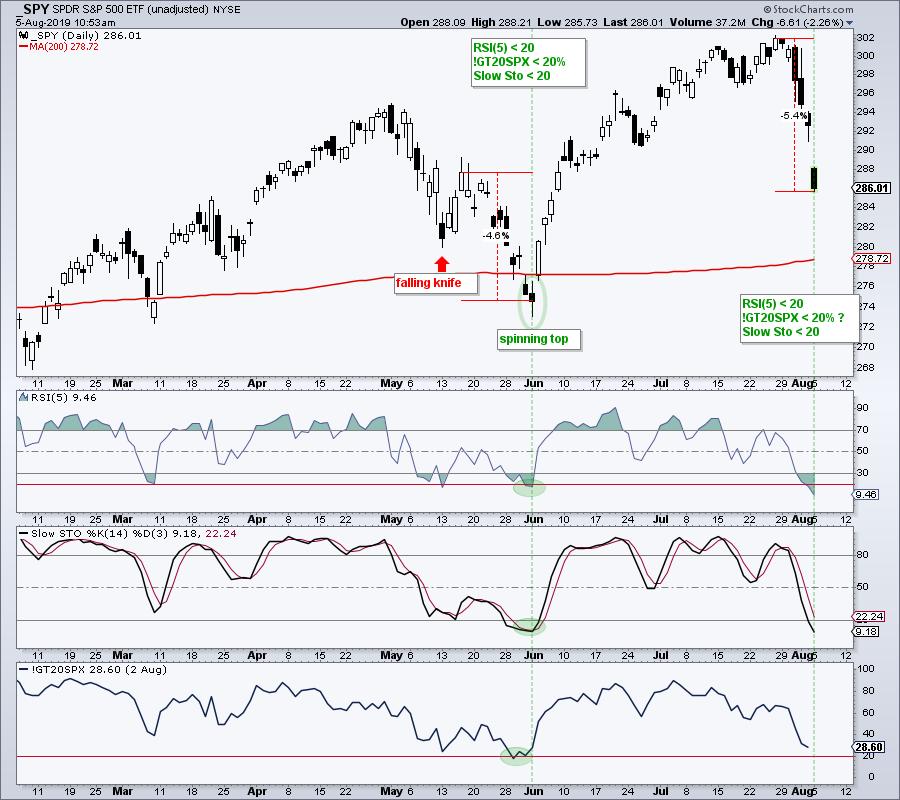
The S&P 500 SPDR (SPY) is down sharply this morning and over the last six days. The ETF hit a new all time high less than two weeks ago and remains above its 200-day SMA, and its early June low. This suggests that the long-term trend remains up... Read More
Don't Ignore This Chart! August 01, 2019 at 11:00 PM
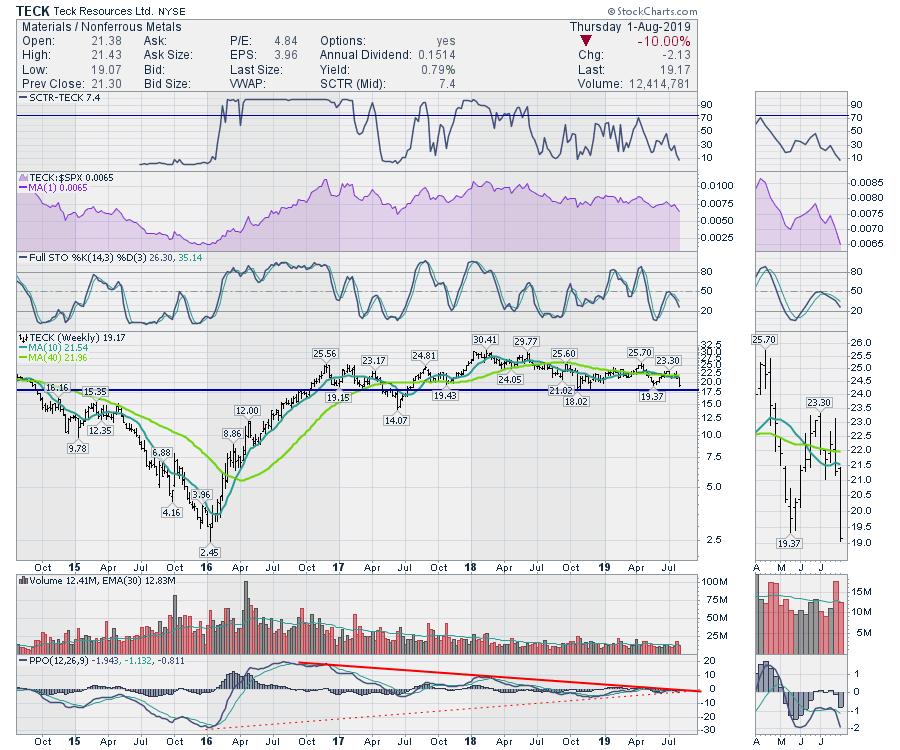
With the weakness accompanying the China trade deal, industrial metals have been getting weaker. This week, the chart of Teck Resources (TECK) turned down again and now looks ready to break to new two-year lows. The SCTR for the stock is at its lowest level in two years... Read More
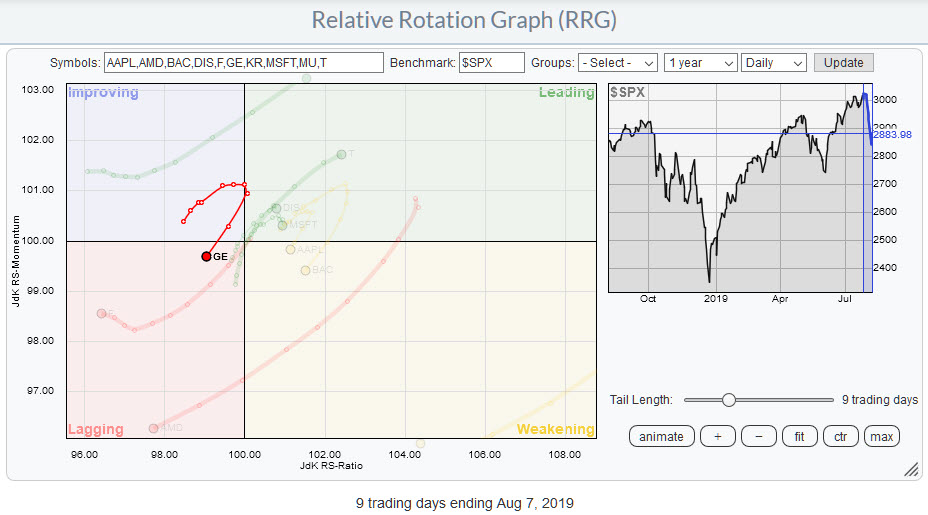
Don't Ignore This Chart! August 01, 2019 at 10:00 AM
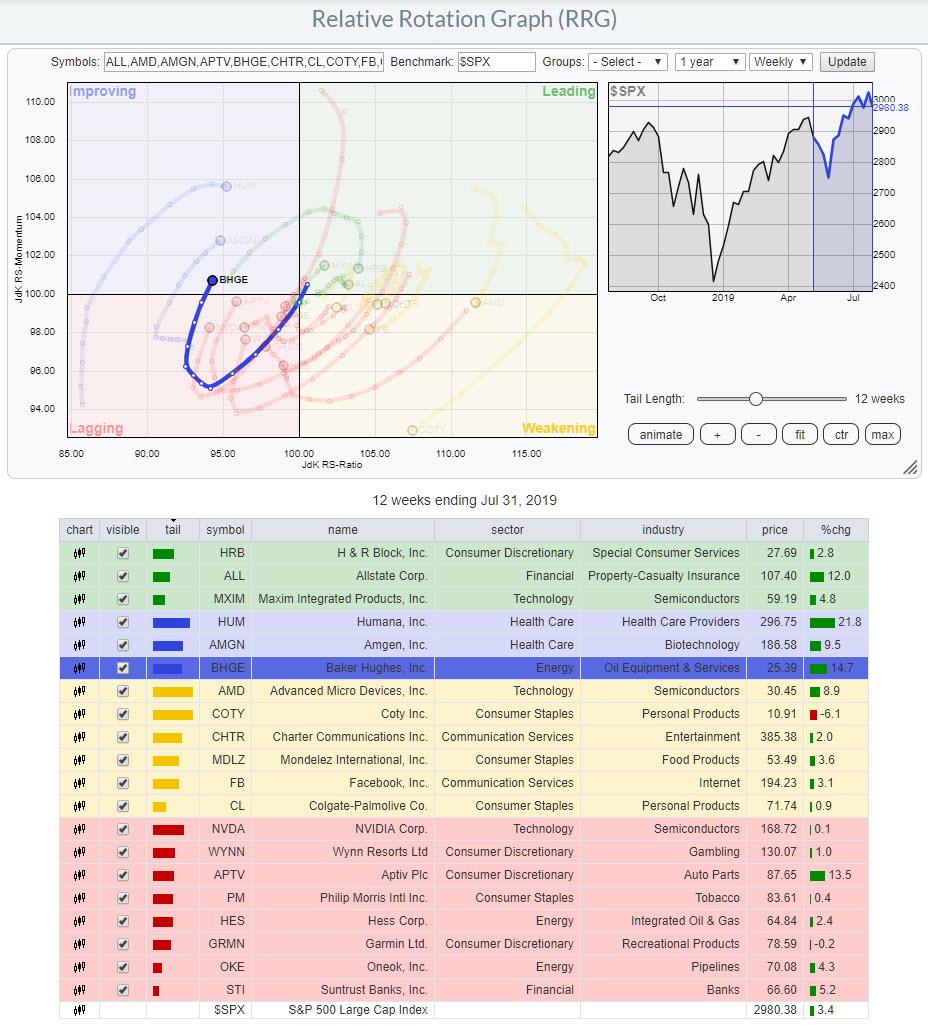
Here's a Relative Rotation Graph filled with stocks that I got off my StockCharts.com dashboard this morning: Your Dashboard is a great way to get an overview of what's going on in the market and organize your workflow on the site... Read More