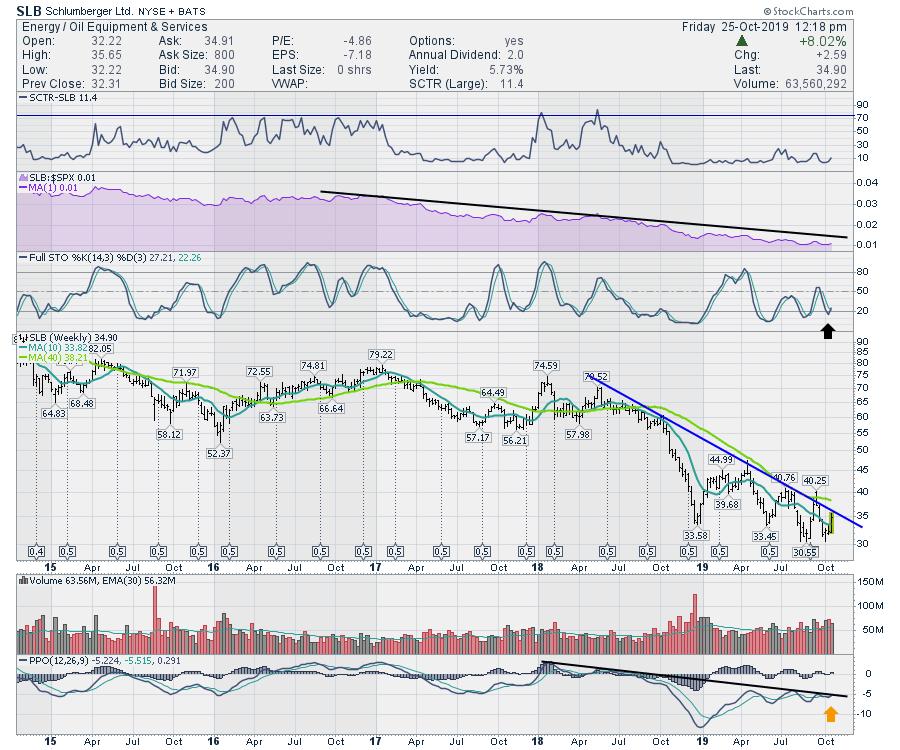
Schlumberger (SLB) has been down and out for a long time. The management team wrote down $12.7B in goodwill and other charges this month. For technicians, the actual science of that write-off is not as important as what investors think of the write-off. If that moves investors out of the stock, that would be a problem. Interestingly enough, Schlumberger is up 8% on the week, so that makes me more interested. The yield is almost 6%, so that's nice!
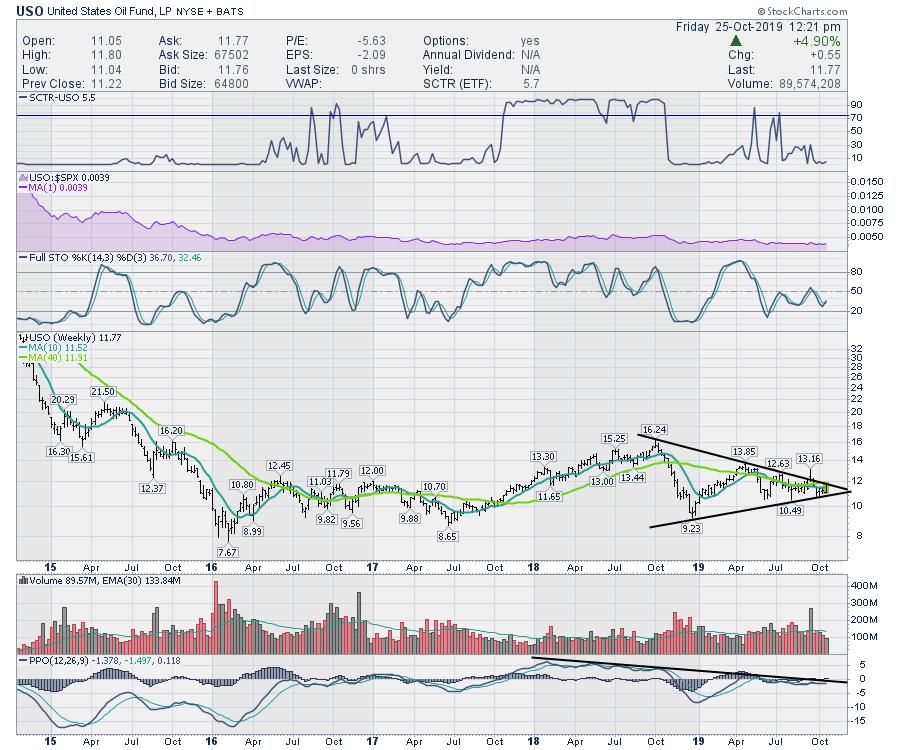
Oil is at one-month highs, so the short-term base seems to be building. That is also bullish. After the price of oil did not hold up when the Saudi oilfields were attacked by drones, it looked dire. Oil inventories were able to handle the sudden shock, but now comes the long-term effects of flat production growth in the USA, as well as 5 million barrels/day of capacity still offline. Wrap that with Iran, Turkey, Iraq, Venezuela, Syria and the trapped Canadian oil and this might generate a nice fourth quarter surge and some meaningful upside to oil.
As ocean-bound freight is finally, begrudgingly moving to diesel from bunker fuel, that tightens up demand for an already-demanding part of the barrel of oil. Thus, the management teams are making desperate decisions as oil prices stabilize near the $50 level, the supply factors are diminish and demand accelerates for more refined product.
We saw a similar setup when oil fell to $25 in late 2015/early 2016 as commodity companies were thrashing staff levels.
The bottom of Schlumberger sits 60% off the five year high. For me, a break in the PPO trend line on both SLB and USO would suggest that this could be a major point of inflection! Don't Ignore This Chart!
If you would like to subscribe to gregschnell.com, this is what you will receive.
You will receive one strong, concise email per week. THE LINKS TO THE WEEKLY VIDEO AND THE CHARTLIST ARE BOTH INCLUDED IN THE PDF.
The email will contain:
1) A PDF file that will have my top ten charts of the week. This is to summarize all of the work I go through every week and give you the best information on market direction.
This will also include my preferred opinion on the market: very aggressive, moderately aggressive, selective, defensive, very defensive. We want to be aggressive coming out of major lows. These runs can last a few weeks to months and perhaps more than a year. I will be investing in the same tone I am recommending.
2) The weekly video which summarizes the major moves in the USA, Canada, rest of world, commodities, bonds and currencies including:
Commodities: Copper, Steel, Rare Earth Metals, Lithium, Gold, Silver, Oil and Natural Gas, Marijuana.
Bonds: 3-month, 2-year, 5-year, 10-year, 30-year.
Equities: The protection of capital to miss the big downside moves, as well as the aggressive entries near the lows to maximize profits in the moves and keeping it as profit in your portfolio. A large part of my work is about making sure that you'll be in tune with the major moves in the indexes.
Currencies: A comprehensive look at the major currency pairs every week. These pairs can drive some of the major changes in world economics. Being aware of these changes when they occur can help you position for new strategies and selections as the changes happen.
Global markets are important to support major uptrends in the North American markets. A summary of this information enables you to be aware of country ETFs that are doing well to help you diversify your portfolio across global markets.
Again, the purpose of the subscription service is to give you a concise one-hour video of information to keep you abreast of the long term trends and places to look for big setups. This is not a daily suggestion box or a chat facility. It is for serious investors, with small or large amounts of capital to deploy so that you know when the positive winds are at your back while looking for gains and protecting capital.
Follow this link and select the options which work for you. GregSchnell.com
Good trading,
Greg Schnell, CMT, MFTA
Senior Technical Analyst, StockCharts.com
Author, Stock Charts For Dummies
Want to stay on top of the market's latest intermarket signals?
– Follow @SchnellInvestor on Twitter
– Connect with Greg on LinkedIn
– Subscribe to The Canadian Technician
– Email at info@gregschnell.com