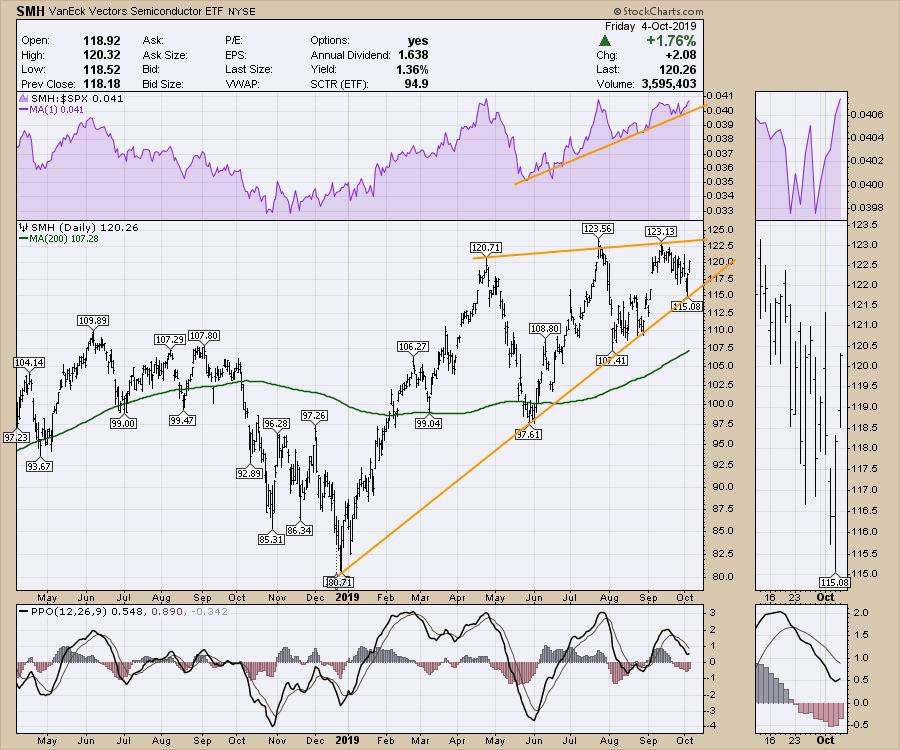
One area that showed strength this week is the Semiconductor space, which closed the week up 2% while the indexes were broadly down. There are so many positives on the chart! First of all, the relative strength (in purple) is close to hitting fresh new highs. That encouraging relative strength suggests more to come if it can break out here.
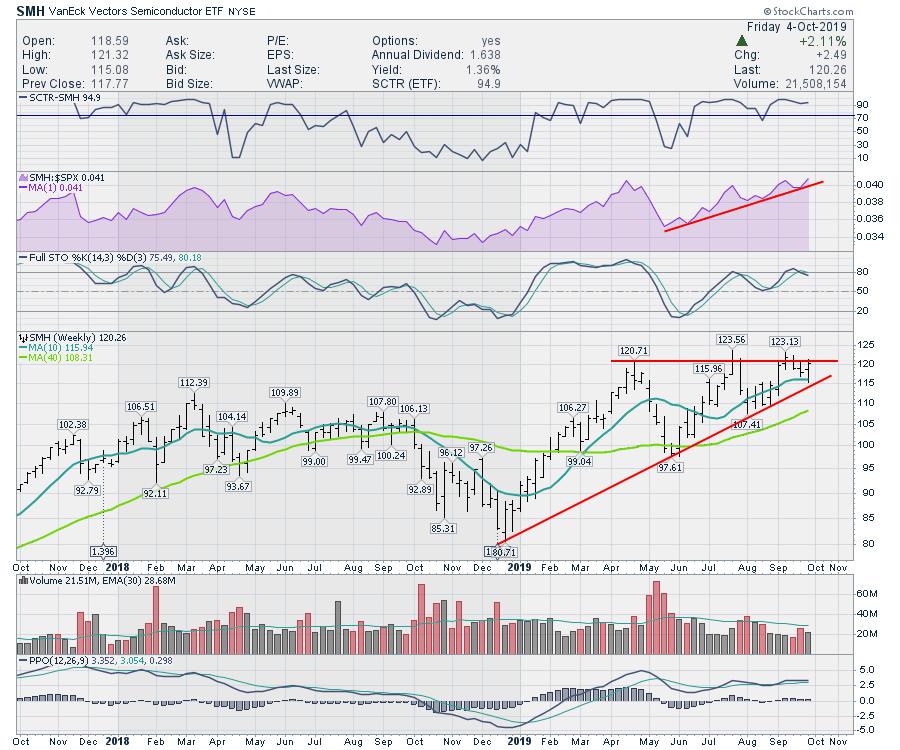
The weekly chart is also interesting. We have approached the corner of the triangle just in time for the US-China trade negotiations. Stay tuned and watch the market reaction closely! One of the big concerns is that PPO momentum has flatlined. This twizzler pattern, where it just twists around on the PPO, suggests indecision. It seems to have reached the decision point on the chart itself, but the PPO is laying flat. No clues there.
While the broader market is struggling it is nice to see some areas of opportunity! Don't forget to check out the ChartWatchers articles this weekend.
I continue to make progress on my website for a new subscription service I am building. As a non-techie, it surprises me how much has to happen to get all the plumbing to work. With a few experts helping me, we are getting closer! Please head over to gregschnell.com to submit your email address; that way, you will get an email in the next few days with the introductory offer inside. For all of the readers that have followed my work closely over the years, I will have a specific, deep discount for you. Thank you for all your support!
Good trading,
Greg Schnell, CMT, MFTA
Senior Technical Analyst, StockCharts.com
Author, Stock Charts For Dummies
Want to stay on top of the market's latest intermarket signals?
– Follow @SchnellInvestor on Twitter
– Connect with Greg on LinkedIn
– Subscribe to The Canadian Technician
– Email at info@gregschnell.com