 Daily RRG showing Growth vs. Value relationship
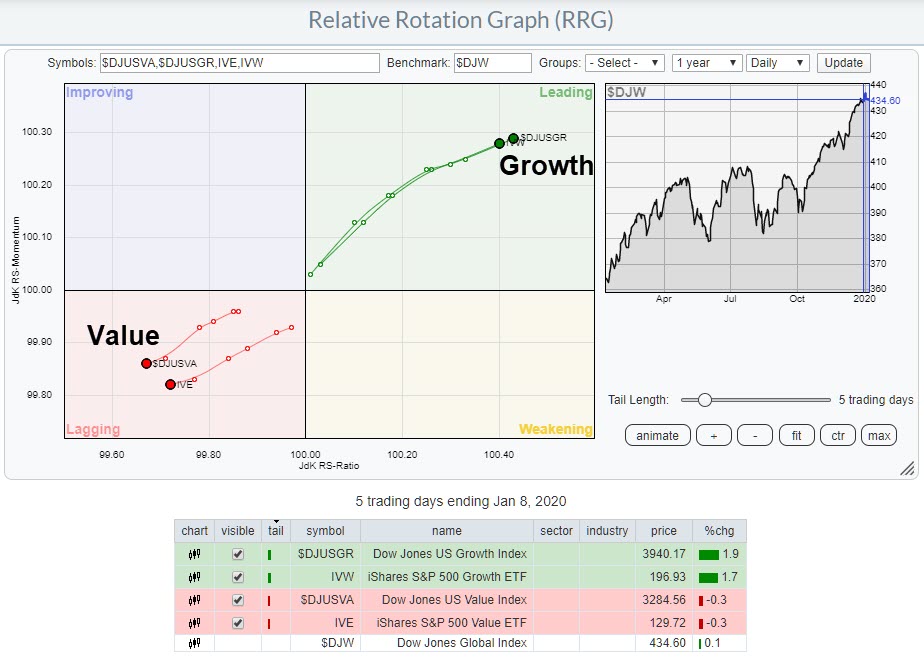
Relative Rotation Graphs enable us to see beyond sectors or individual stock rotations; they can also be used to visualize differently-sorted market segments.
The RRG above illustrates growth vs. value stocks, a measure that often is also used to gauge the direction for the general market. In general, growth will do well/better when the market is going up while value does well/better when the market is going down.
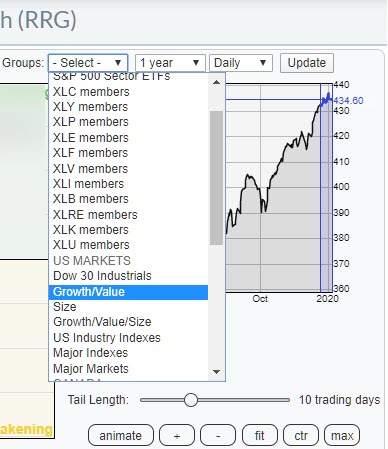 The default RRG that is available from the drop-down list on the RRG page only shows the DJ US Growth index and DJ US Value index on an RRG, with the DJ Global Index as the benchmark. In order to make this more actionable, I have added two tradable ETFs to the image above.
There are plenty of ETFs that can be used to create exposure to either Growth or Value stocks. A few that spring to mind are:
- Growth: IWF,IVW,IWO,SPYG
- Value: IWD,IWN,IVE,SPYV
For this example, I picked IVE and IVW to overlay on the pre-defined image.
The tails for the growth index/ETF are pretty much on top of each other. The tails for the value index/ETF are slightly separated. But what is most important is that the tails on the ETFs are traveling in the same direction as the indexes.
The chart below shows:
- IVW price
- IVW relative to $DJW
- IVE price
- IVE relative to $DJW
- IVE relative to IVW
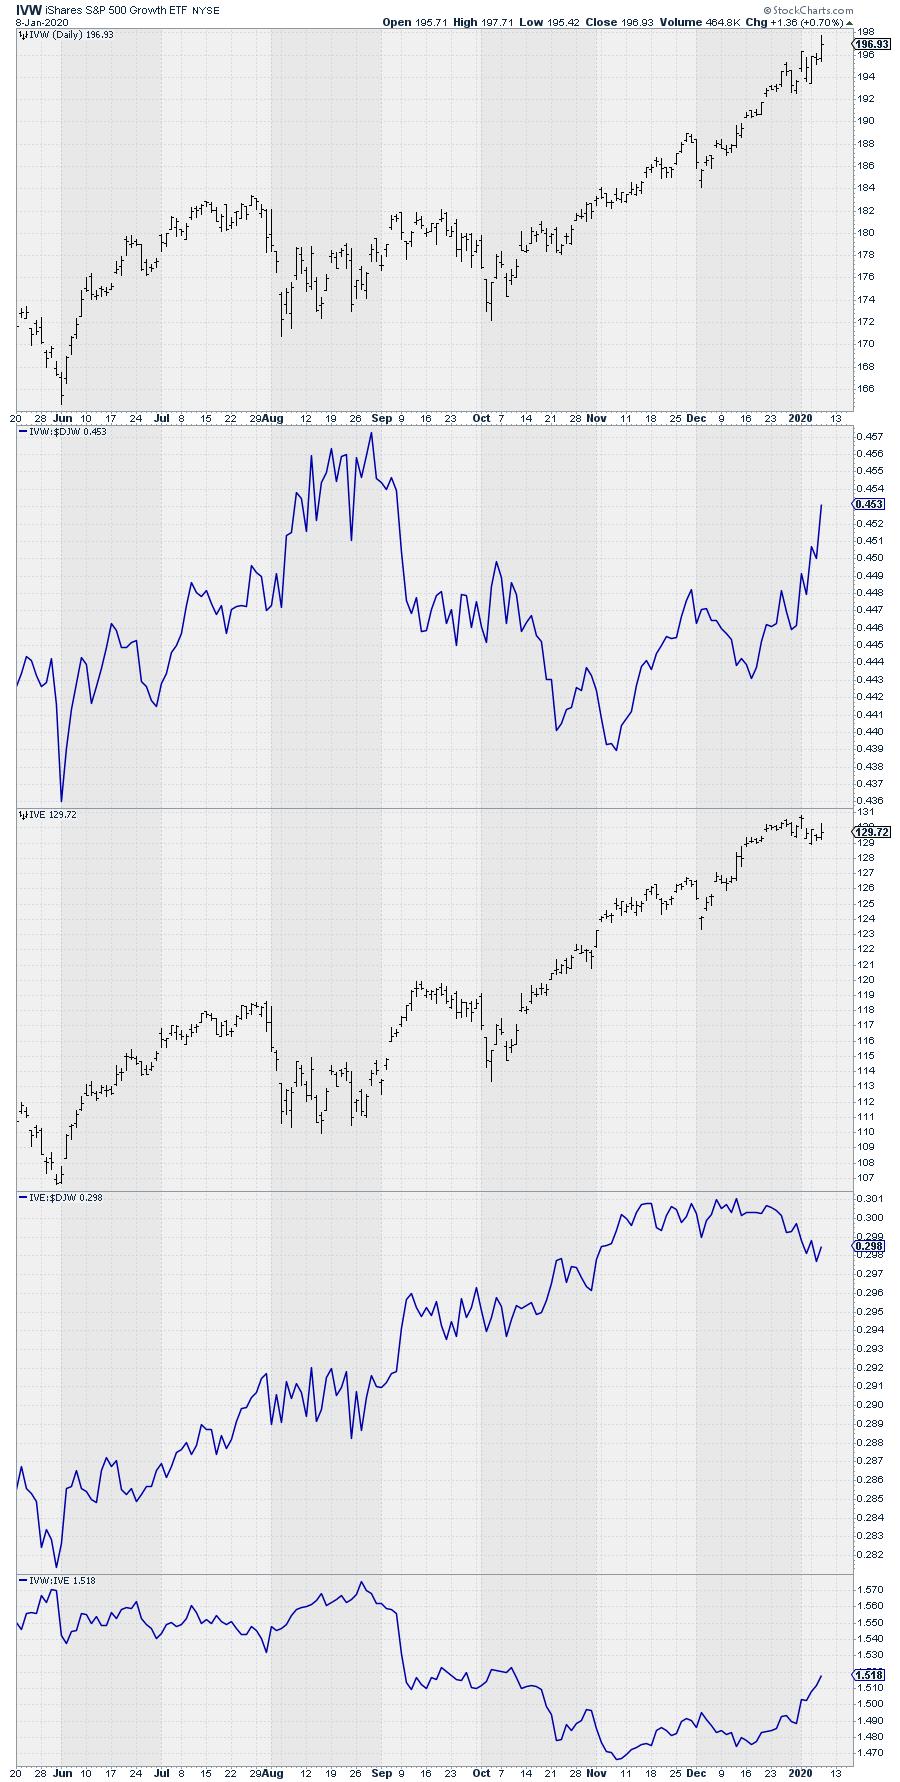
The rotations on this Relative Rotation Graph, in combination with the price and above RRGs, suggest a clear outperformance for Growth (IVW) over Value (IVE) in coming weeks.
--Julius
My regular blog is the RRG Chartsblog. If you would like to receive a notification when a new article is published there, simply "Subscribe" with your email address.
Julius de Kempenaer
Senior Technical Analyst, StockCharts.com
Creator, Relative Rotation Graphs
Founder, RRG Research
Want to stay up to date with the latest market insights from Julius?
– Follow @RRGResearch on Twitter
– Like RRG Research on Facebook
– Follow RRG Research on LinkedIn
– Subscribe to the RRG Charts blog on StockCharts
Feedback, comments or questions are welcome at Juliusdk@stockcharts.com. I cannot promise to respond to each and every message, but I will certainly read them and, where reasonably possible, use the feedback and comments or answer questions.
To discuss RRG with me on S.C.A.N., tag me using the handle Julius_RRG.
RRG, Relative Rotation Graphs, JdK RS-Ratio, and JdK RS-Momentum are registered trademarks of RRG Research.
Julius de Kempenaer
Senior Technical Analyst, StockCharts.com
Creator, Relative Rotation Graphs
Founder, RRG Research
Host of: Sector Spotlight
Please find my handles for social media channels under the Bio below.
Feedback, comments or questions are welcome at Juliusdk@stockcharts.com. I cannot promise to respond to each and every message, but I will certainly read them and, where reasonably possible, use the feedback and comments or answer questions.
To discuss RRG with me on S.C.A.N., tag me using the handle Julius_RRG.
RRG, Relative Rotation Graphs, JdK RS-Ratio, and JdK RS-Momentum are registered trademarks of RRG Research.